View methods side by side.
Choose up to four methods. Add them using the search and share the comparison by copying its link.
| Criterion | 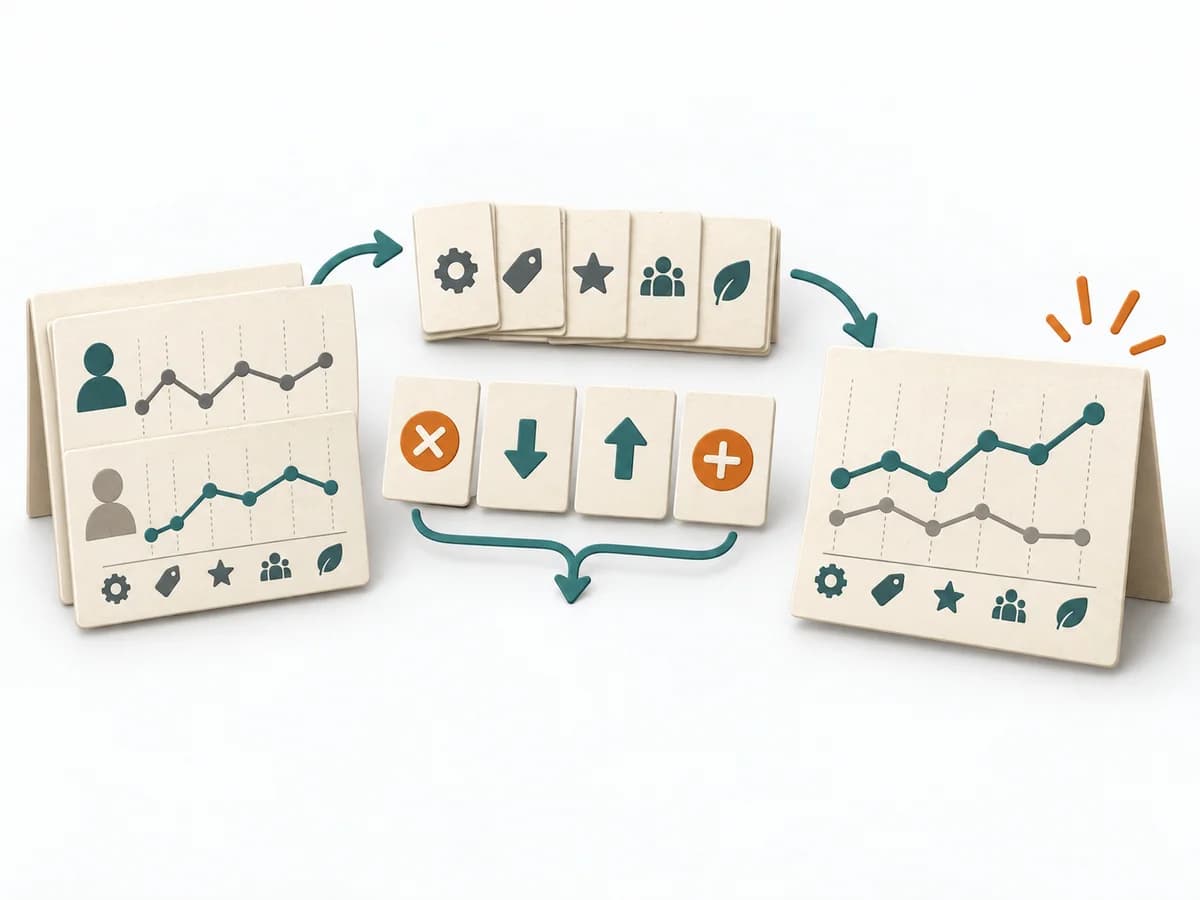 Business Strategy Blue Ocean Strategy Canvas |  Systems Thinking Leverage Points |  Systems Thinking Systems Mapping | 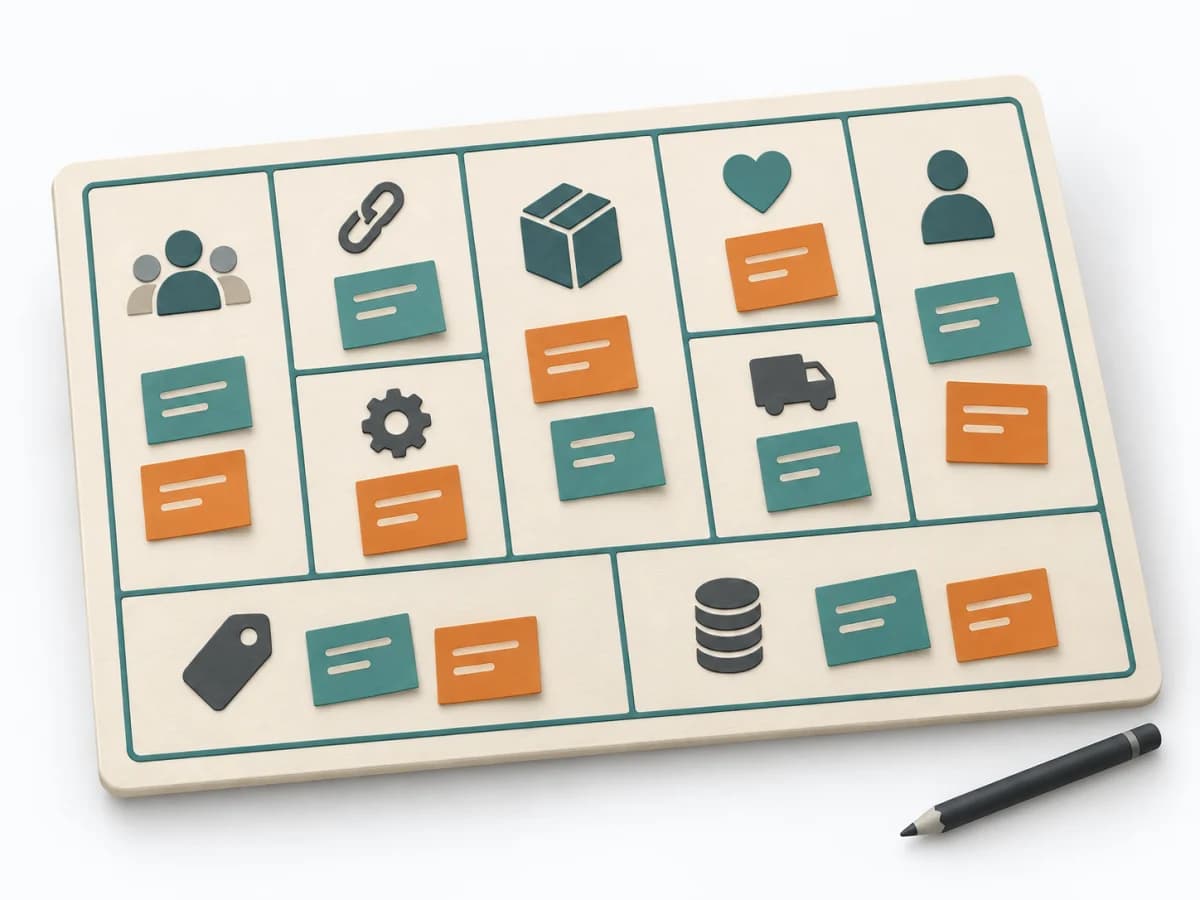 Business Strategy Business Model Canvas |
|---|---|---|---|---|
Purposedifferent | The Blue Ocean Strategy Canvas shows how an offering is positioned relative to the market. Differentiation thereby becomes tangible in value factors instead of merely being claimed. | Leverage Points show exactly where interventions in a system produce a disproportionate effect. It draws relationships, patterns, and feedback loops. The result is captured as a leverage map and action strategy. | Systems Mapping arranges elements, relationships, and boundaries so a complex field becomes legible at a glance. The overview stabilizes the overall picture before detail work or steering begins. | The Business Model Canvas condenses a business model to its key building blocks and assumptions. It makes variants quickly comparable and reveals gaps before validation or implementation begins. |
Complexitydifferent | Medium | High | Medium | Medium |
Timedifferent | 2-4 h | Half day | 1-3 h | 1-2 h |
Participantsdifferent | 3-10 | 3-12 | 3-12 | 2-8 |
Formatdifferent | Workshop | Workshop | Workshop + async | Workshop + async |
Outputdifferent | Strategy Canvas, Value Curve, ERRC Actions | Leverage Map, Action Strategy | System Map, Dependencies, Leverage Points | Business Model Canvas, Assumption List, Business Hypotheses |
Tagsno overlap | StrategyPositioningInnovationValue | Systems thinkingChangeStrategy | Systems thinkingMappingBoundariesChange | Business modelStrategyValueInnovation |