View methods side by side.
Choose up to four methods. Add them using the search and share the comparison by copying its link.
| Criterion | 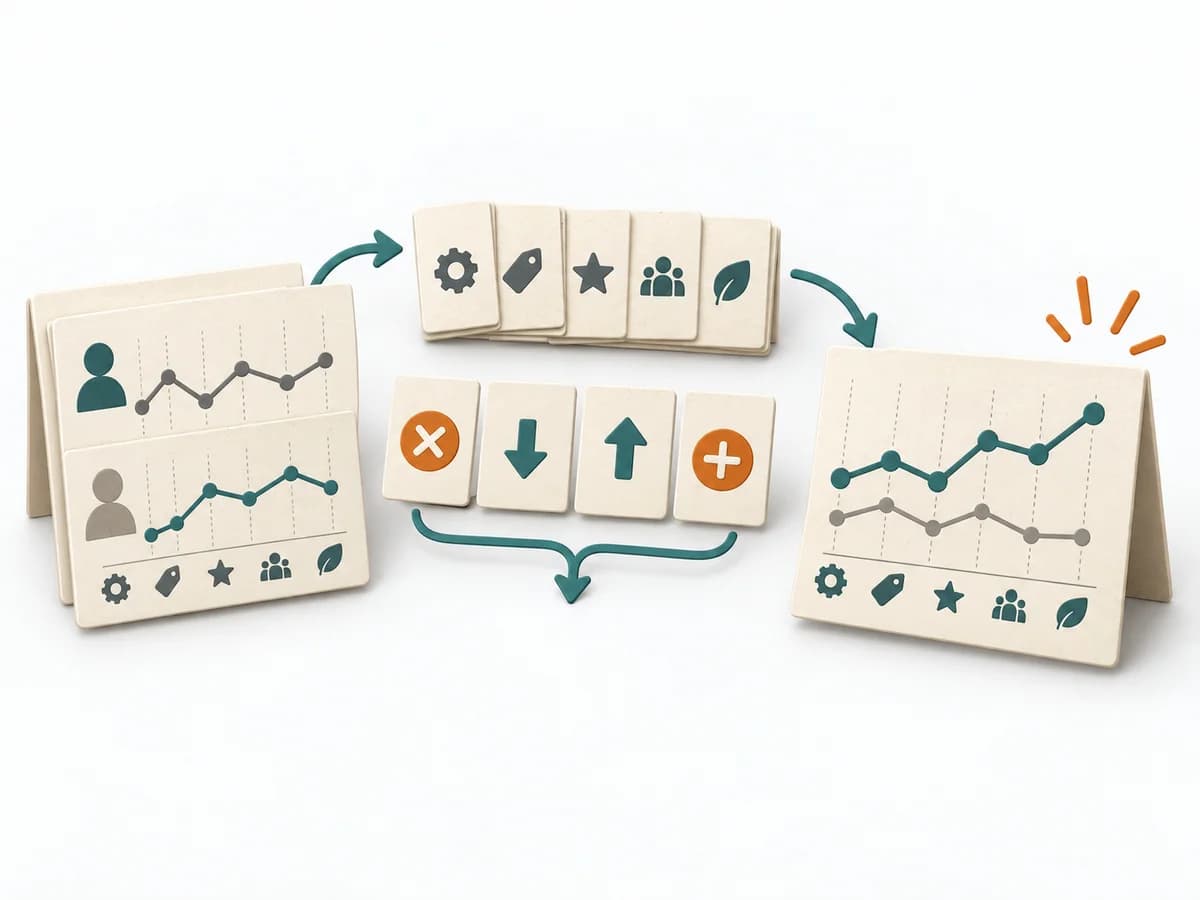 Business Strategy Blue Ocean Strategy Canvas |  Growth Funnel Analysis | 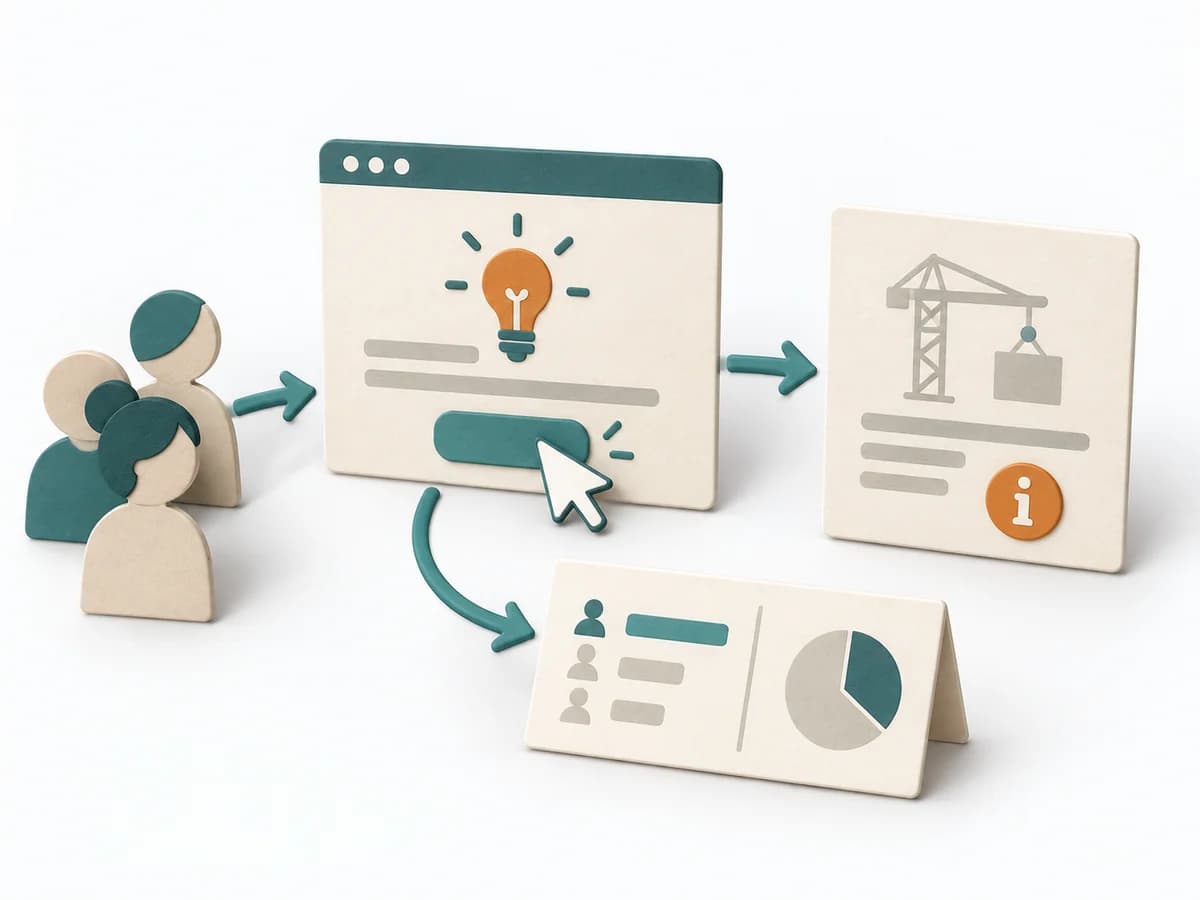 Product Discovery Fake Door Test | 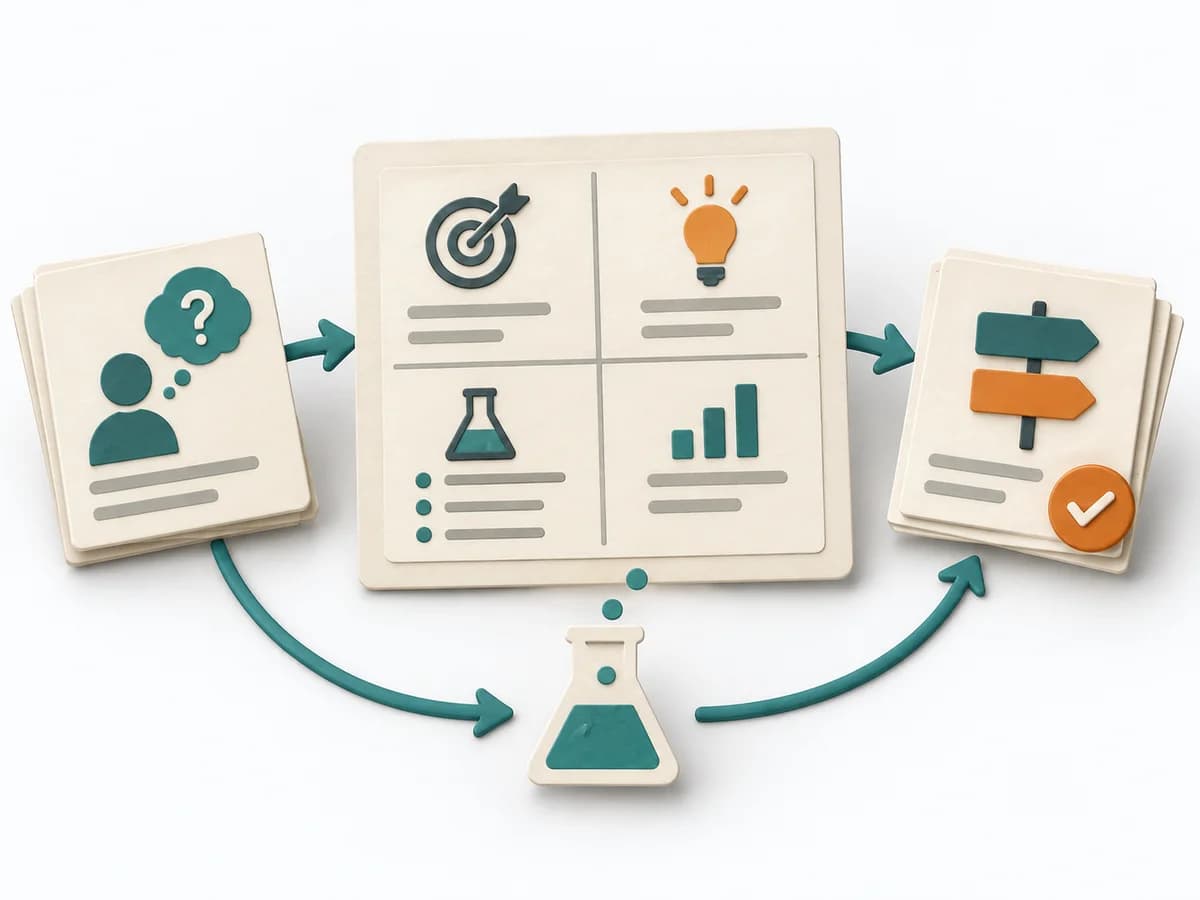 Product Discovery Experiment Canvas |
|---|---|---|---|---|
Purposedifferent | The Blue Ocean Strategy Canvas shows how an offering is positioned relative to the market. Differentiation thereby becomes tangible in value factors instead of merely being claimed. | When many visitors or users drop off along the way, the reason behind the number often stays hidden. Funnel Analysis exposes these transitions and makes visible exactly where the path collapses. | When demand is still unclear, it measures interest in a feature before it is built. It separates real behavior from polite agreement and deliberately keeps build effort small. | When experiments become unreadable after the fact, it arranges hypothesis, signal, and learning goal on a single canvas. It separates problem, assumption, solution, and evidence. The result is captured as a Completed Experiment Canvas and a Success Metric. |
Complexitydifferent | Medium | Medium | Medium | Low |
Timedifferent | 2-4 h | 1-3 h | 1-5 Tage | 30-60 min |
Participantsdifferent | 3-10 | 1-5 | Nutzertraffic | 1-5 |
Formatdifferent | Workshop | Async | Async | Workshop + async |
Outputdifferent | Strategy Canvas, Value Curve, ERRC Actions | Funnel report, Drop-off analysis, Optimization hypotheses | Click Data, Interest Signal, Learning Decision | Completed Experiment Canvas, Success Metric |
Tagsno overlap | StrategyPositioningInnovationValue | AnalyticsConversionGrowth | ValidationExperimentsDemandDiscovery | ExperimentsValidationDiscoveryHypothesis |