View methods side by side.
Choose up to four methods. Add them using the search and share the comparison by copying its link.
| Criterion |  Systems Thinking Behavior Over Time Graph |  Decision Making Red Teaming | 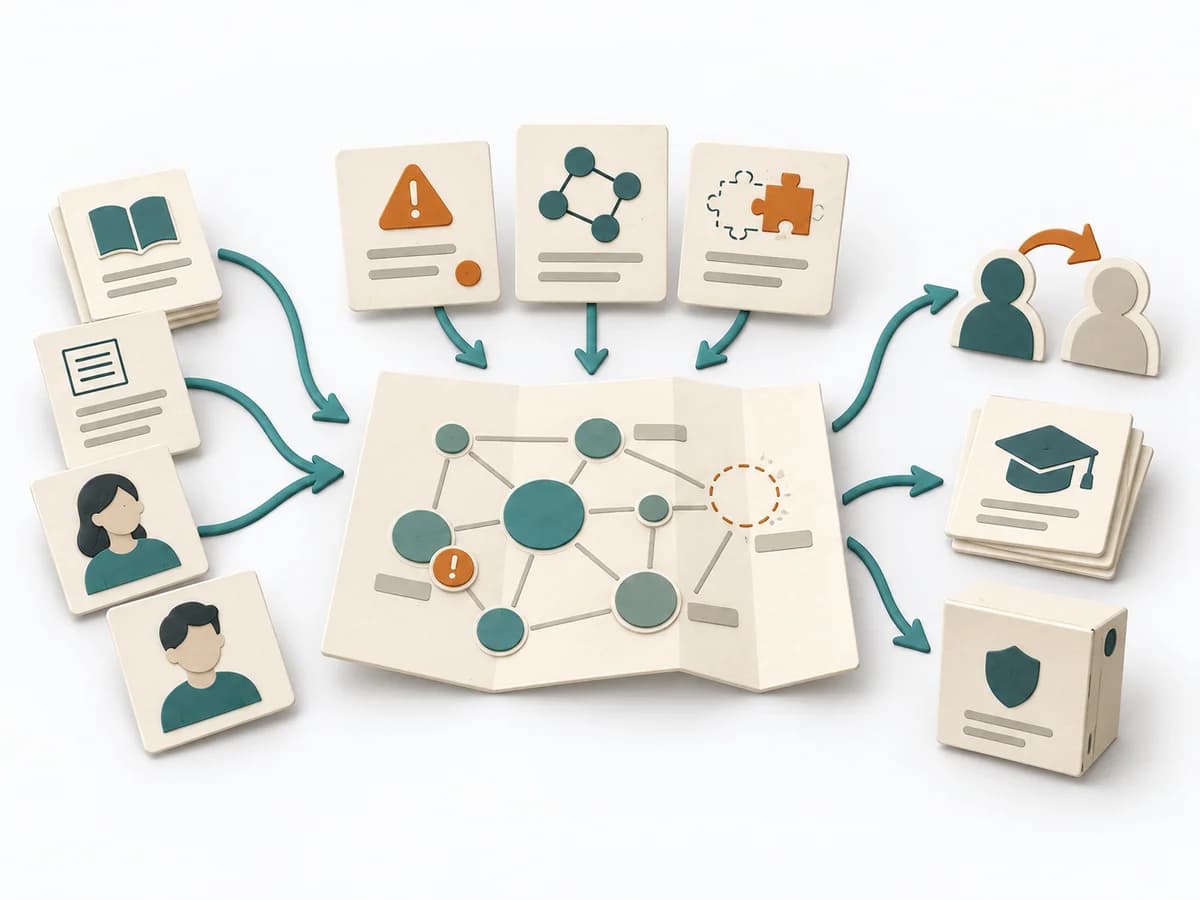 Knowledge Modeling Knowledge Mapping | 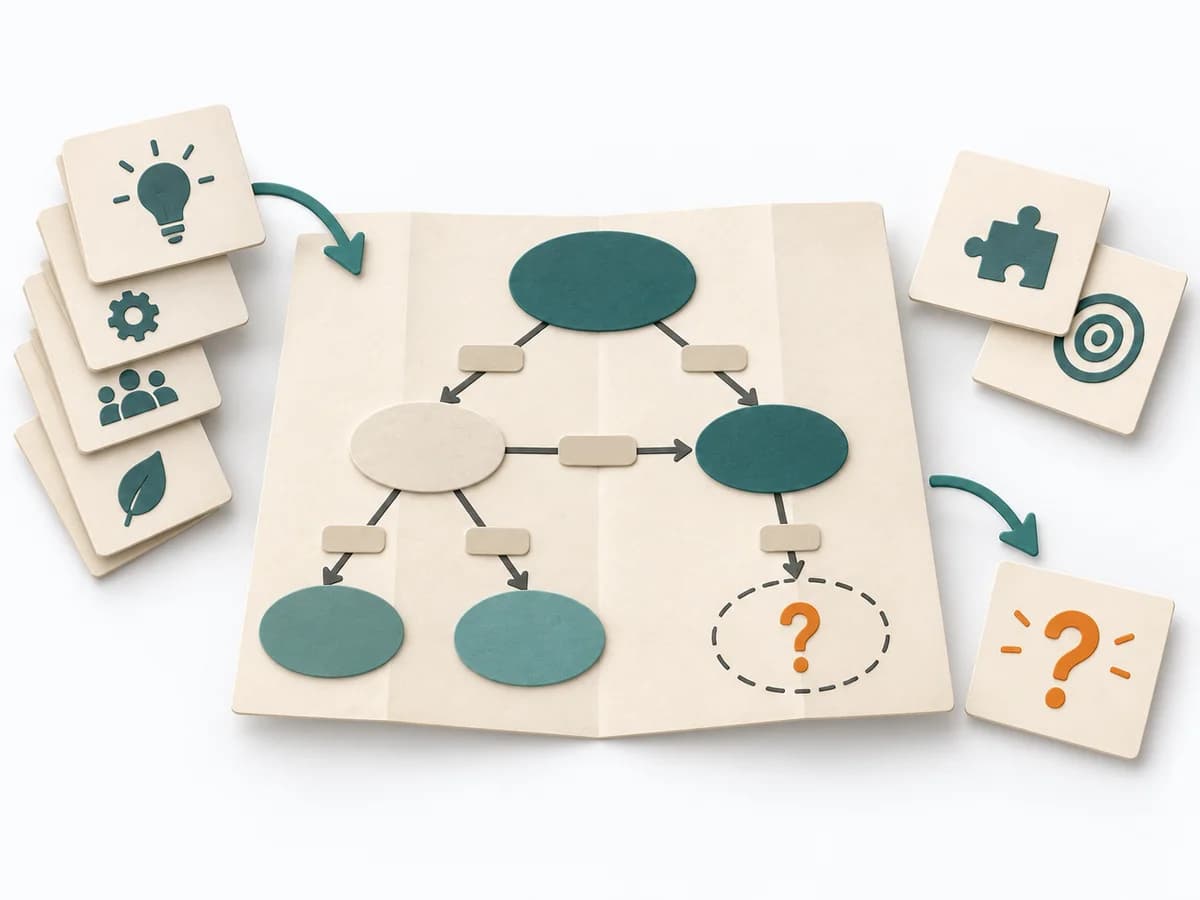 Knowledge Modeling Concept Mapping |
|---|---|---|---|---|
Purposedifferent | A Behavior Over Time Graph shows how a metric or observation develops over time. The method makes trends, breaks, and recurring patterns visible that get lost in snapshots. | For strategic decisions with high reach, agreement and gut feeling are often not enough. Red teaming brings deliberate opposition into the situation and tests where a plan breaks under real counterarguments. | Knowledge Mapping makes knowledge, gaps, and transfer paths visible across a field. It fits when expertise should not just exist but also be findable and transferable. | Concept Mapping arranges terms and relationships in a network that makes subject-matter connections tangible. It fits when a topic needs to be understood structurally rather than linearly. |
Complexitydifferent | Low | High | Medium | Medium |
Timedifferent | 20-45 min | 1-4 h | 1-3 h | 1-2 h |
Participantsdifferent | 1-10 | 3-8 | 3-12 | 1-8 |
Formatdifferent | Workshop + async | Workshop | Workshop | Workshop + async |
Outputdifferent | Behavior Over Time Graph, Trend Hypotheses, Key Events | Challenge Findings, Risk Register, Mitigation Plan | Knowledge Map, Critical Knowledge Areas, Transfer Plan | Concept Map, Relationship Labels, Knowledge Gaps |
Tagsno overlap | Systems thinkingPatternsDynamics | RiskDecisionSensemaking | KnowledgeMappingRisk | KnowledgeConceptsMappingSensemaking |