View methods side by side.
Choose up to four methods. Add them using the search and share the comparison by copying its link.
| Criterion |  Systems Thinking Behavior Over Time Graph | 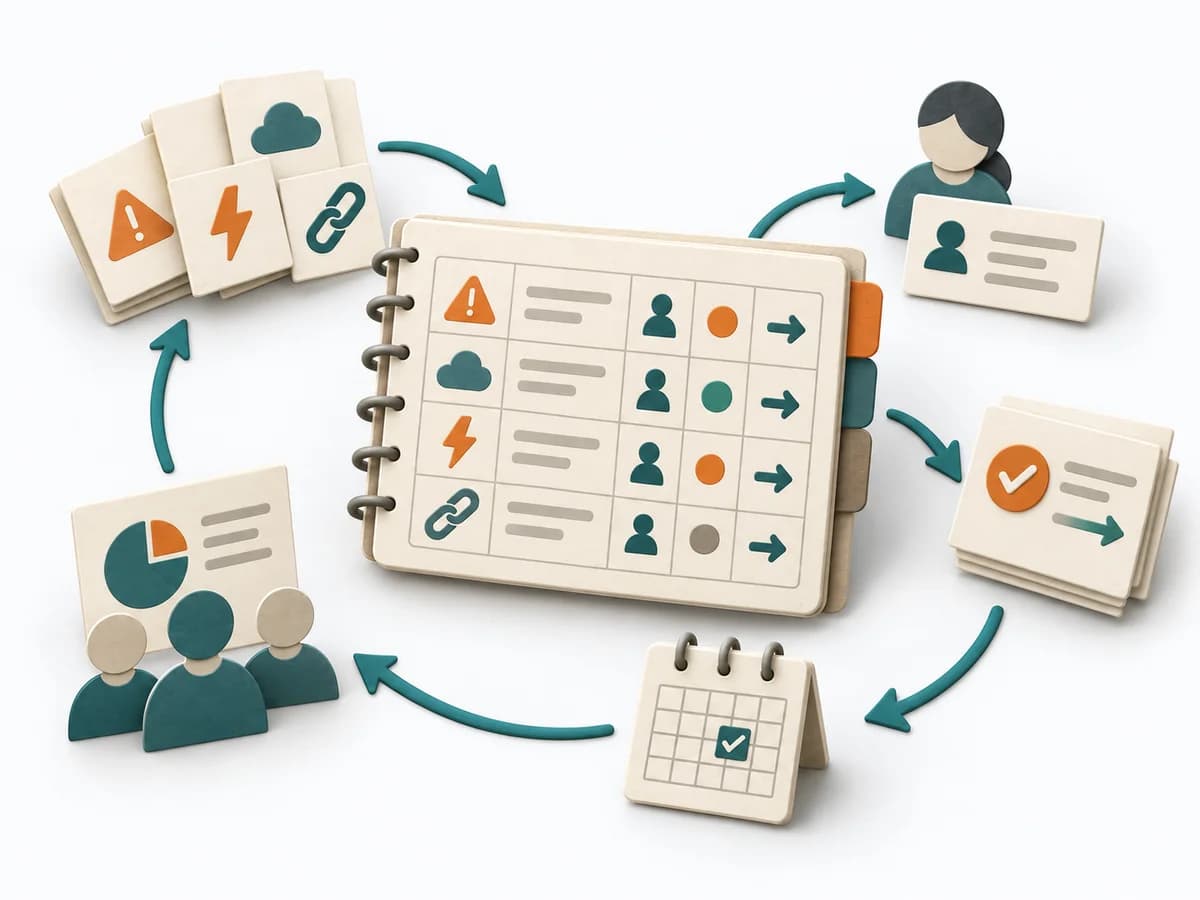 Delivery RAID Log |  Architecture Views and Beyond | 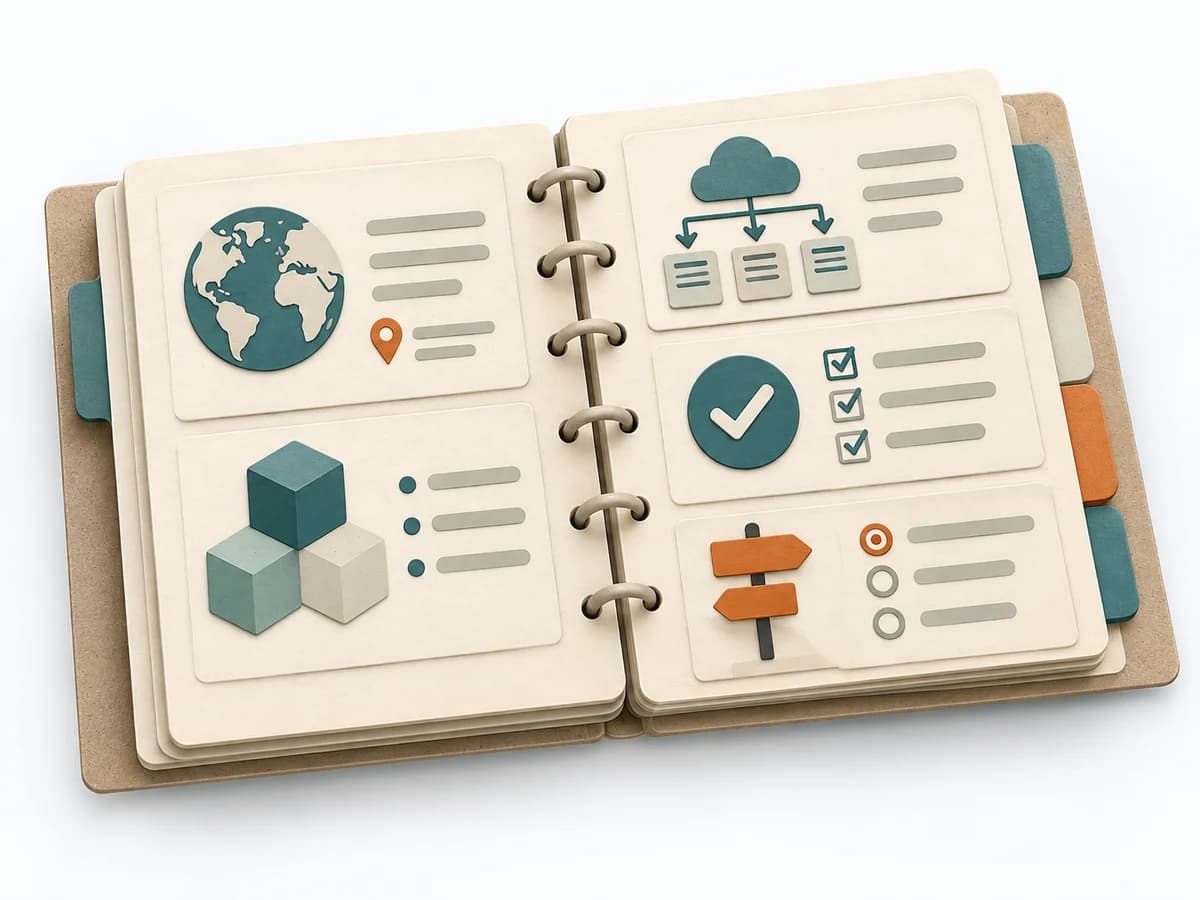 Architecture arc42 |
|---|---|---|---|---|
Purposedifferent | A Behavior Over Time Graph shows how a metric or observation develops over time. The method makes trends, breaks, and recurring patterns visible that get lost in snapshots. | Helps clarify scope, sequence, and delivery flow in concrete terms. It makes work, boundaries, and order steerable. The result is captured as a RAID Log and a source for status reporting. | Views and Beyond organizes architecture into several views so no single diagram has to do everything at once. This makes it possible to choose the representation that fits the stakeholder's question. | arc42 structures architecture knowledge so teams can document system, decisions, and risks consistently. The template builds a living understanding of the architecture instead of scattered notes. |
Complexitydifferent | Low | Low | Medium | Low |
Timedifferent | 20-45 min | 30 min Setup, dann laufend | 1-3 Tage | 1-2 Tage |
Participantsdifferent | 1-10 | 1-3 maintaining, briefing for everyone | 1-4 | 1-4 |
Formatdifferent | Workshop + async | Async | Workshop + async | Workshop + async |
Outputdifferent | Behavior Over Time Graph, Trend Hypotheses, Key Events | RAID Log, Status Report Source | Architecture Views, Cross-view Notes, Rationale | Architecture Document, Context View, Runtime View, Deployment View |
Tagsno overlap | Systems thinkingPatternsDynamics | RiskTrackingStakeholdersGovernance | DocumentationStakeholdersArchitecture | ArchitectureDocumentationCommunication |