View methods side by side.
Choose up to four methods. Add them using the search and share the comparison by copying its link.
| Criterion |  Systems Thinking Behavior Over Time Graph | 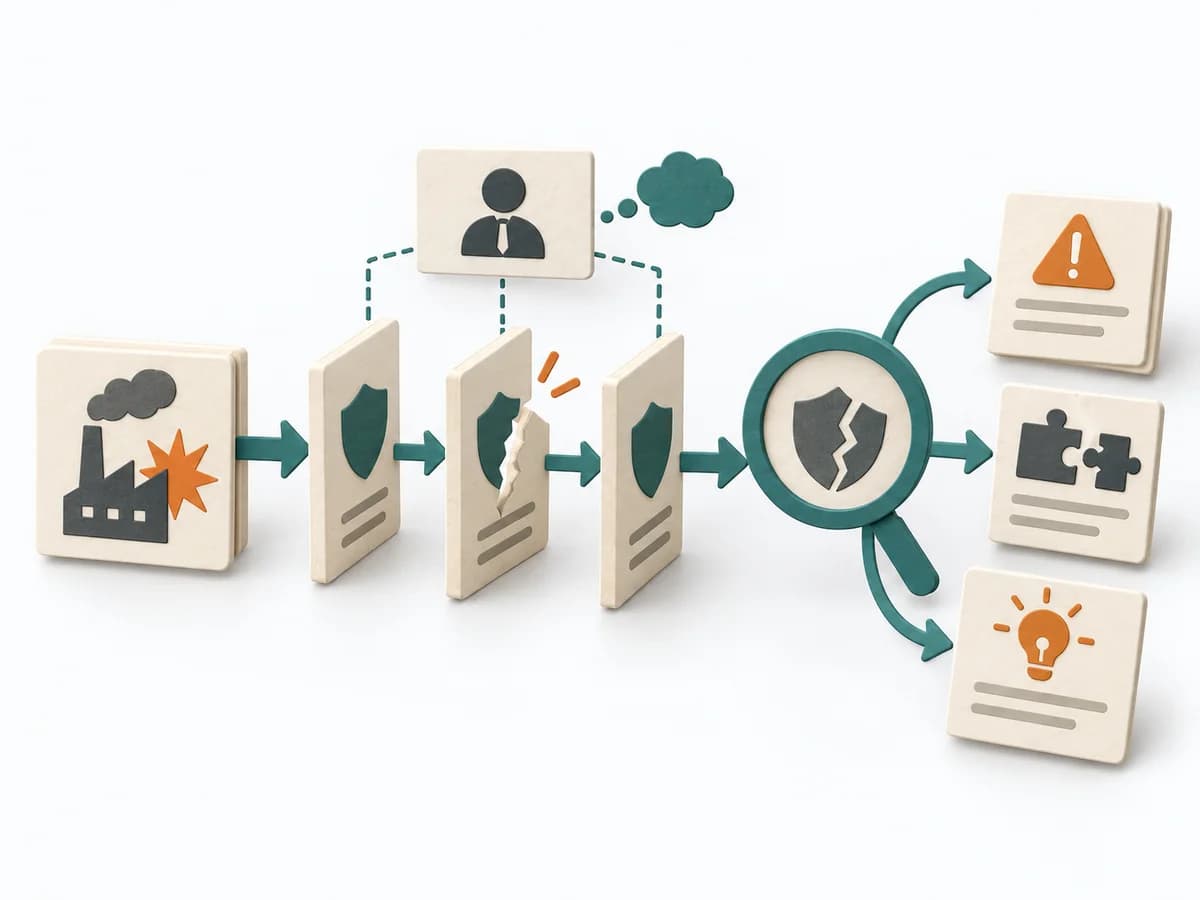 Operations MORT Analysis |  Systems Thinking Iceberg Model |  Operations 5 Whys |
|---|---|---|---|---|
Purposedifferent | A Behavior Over Time Graph shows how a metric or observation develops over time. The method makes trends, breaks, and recurring patterns visible that get lost in snapshots. | For a safety-relevant event or a system with high protection requirements, the method examines where controls failed. It exposes both technical and organizational gaps. | The Iceberg Model separates visible events from patterns, structures, and mental models. This turns a single observation into a deeper understanding of why a problem keeps recurring. | For a single, hard-to-explain deviation, the method exposes the causal chain behind the visible symptom. It keeps the cause open until a controllable condition emerges instead of a mere description. |
Complexitydifferent | Low | High | Low | Low |
Timedifferent | 20-45 min | Mehrere Tage bis Wochen | 30-60 min | 15-30 min |
Participantsdifferent | 1-10 | 2-6 | 2-10 | 2-6 |
Formatdifferent | Workshop + async | Workshop + async | Workshop + async | Workshop |
Outputdifferent | Behavior Over Time Graph, Trend Hypotheses, Key Events | MORT Worksheets, Findings per Branch, Corrective Actions, Systemic Recommendations | Iceberg Worksheet, Pattern Notes, Intervention Ideas | Root cause notes, Countermeasures |
Tagsno overlap | Systems thinkingPatternsDynamics | Root causeSafetySystemicIncident | Systems thinkingRoot causePatterns | Root causeIncidentLeanProblem solving |