View methods side by side.
Choose up to four methods. Add them using the search and share the comparison by copying its link.
| Criterion |  Systems Thinking Behavior Over Time Graph | 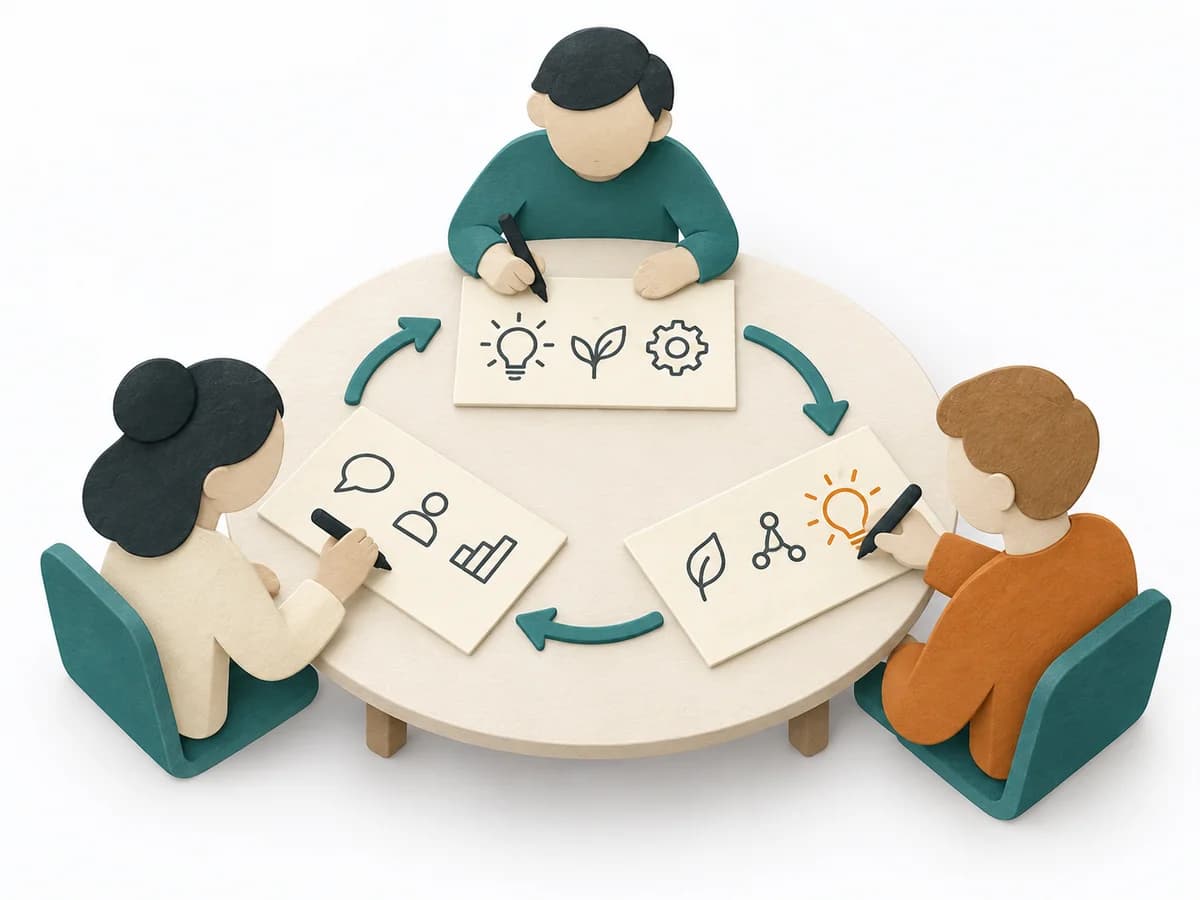 Innovation Brainwriting | 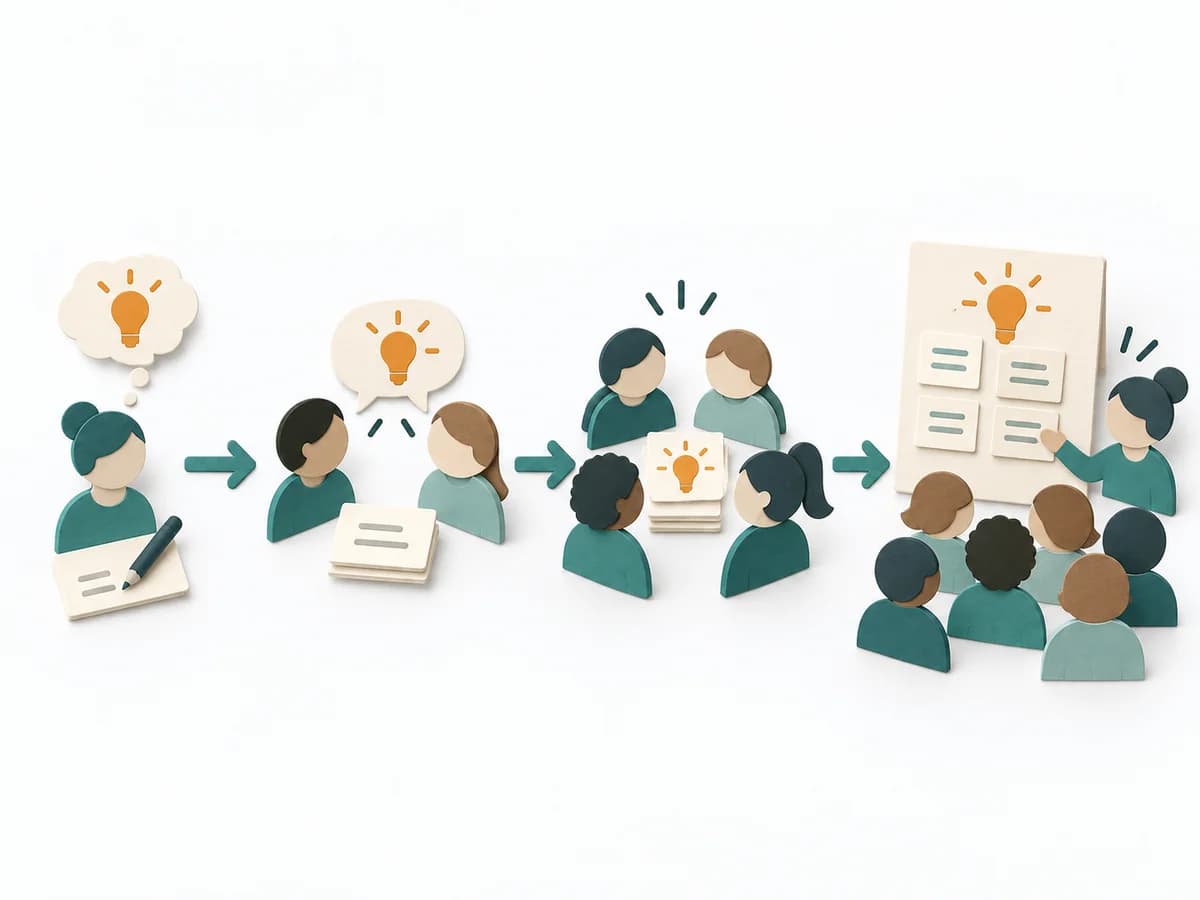 Facilitation 1-2-4-All |  Facilitation Mind Mapping |
|---|---|---|---|---|
Purposedifferent | A Behavior Over Time Graph shows how a metric or observation develops over time. The method makes trends, breaks, and recurring patterns visible that get lost in snapshots. | When loud voices or hierarchy distort the idea search, the method creates a quiet entry into joint development. It gives everyone thinking space and gathers contributions without social brakes, making diversity more visible and easier to build on. | When many people in a group too rarely get to speak, 1-2-4-All distributes thinking time more fairly. The format builds participation step by step and makes quiet or still-unformed thoughts usable faster. | When a topic is still unclear and too many thoughts surface at once, Mind Mapping creates an open surface for ordering them. It makes connections, subtopics, and starting points visible without fixing them too early. |
Complexitysame | Low | Low | Low | Low |
Timedifferent | 20-45 min | 15-30 min | 10-20 min | 15-45 min |
Participantsdifferent | 1-10 | 3-12 | 4-100+ | 1-10 |
Formatdifferent | Workshop + async | Workshop + async | Workshop | Workshop + async |
Outputdifferent | Behavior Over Time Graph, Trend Hypotheses, Key Events | Idea sheets, Expanded concepts, Prioritized list | Idea List, Shared Insights, Emergent Themes | Mind Map, Topic Clusters, Open Questions |
Tagsno overlap | Systems thinkingPatternsDynamics | BrainstormingCollaborationInclusionIdeas | FacilitationInclusionIdeation | BrainstormingIdeasMappingStructureFacilitation |