View methods side by side.
Choose up to four methods. Add them using the search and share the comparison by copying its link.
| Criterion |  Systems Thinking Behavior Over Time Graph | 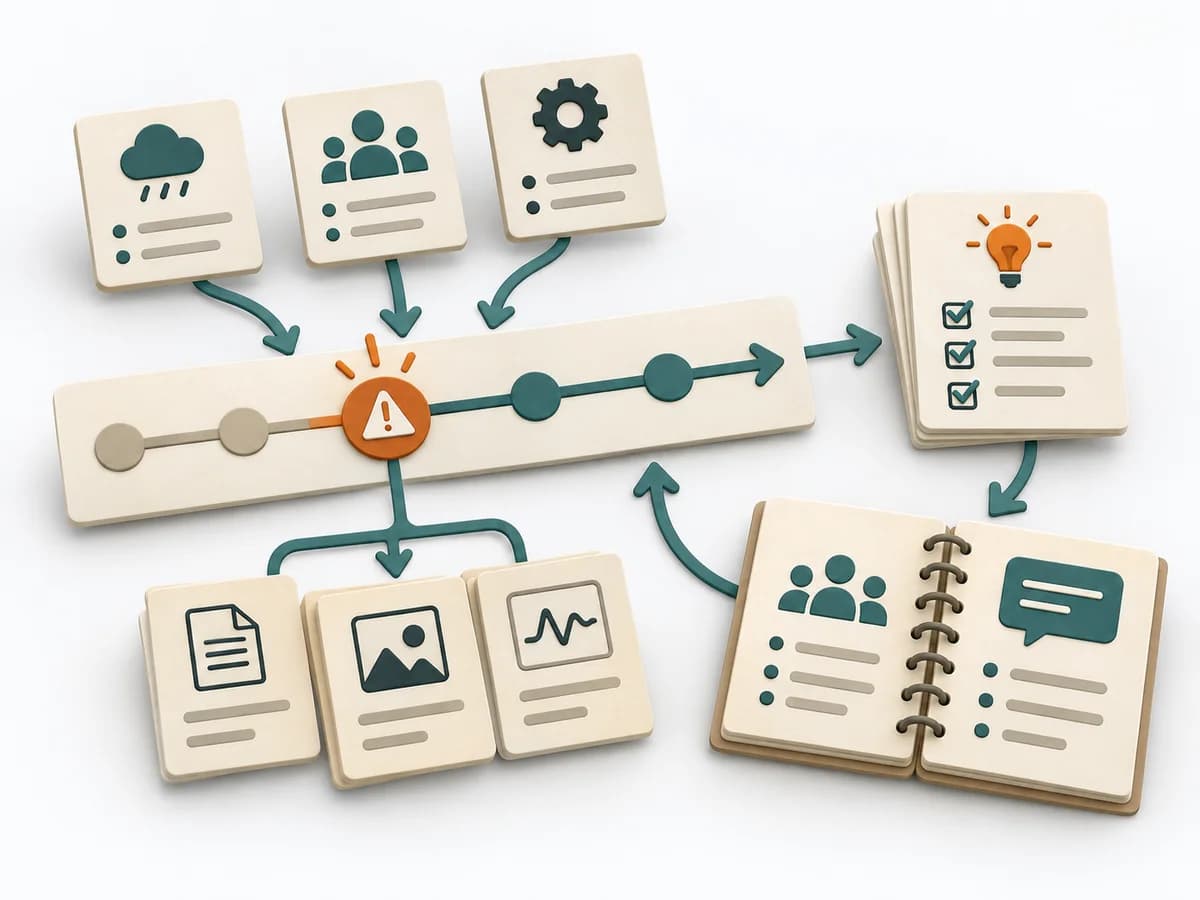 DevOps Blameless Postmortem |  Operations Barrier Analysis |  Systems Thinking Iceberg Model |
|---|---|---|---|---|
Purposedifferent | A Behavior Over Time Graph shows how a metric or observation develops over time. The method makes trends, breaks, and recurring patterns visible that get lost in snapshots. | After an incident with damage or a near miss, the method creates a sober field for learning without assigning blame. It directs attention to the course of events, conditions, and effective countermeasures. | For a risk that can only be managed through multiple layers of protection, the method examines the effectiveness of each barrier. It shows where safeguards are missing, too weak, or fail under real conditions. | The Iceberg Model separates visible events from patterns, structures, and mental models. This turns a single observation into a deeper understanding of why a problem keeps recurring. |
Complexitydifferent | Low | Medium | Medium | Low |
Timedifferent | 20-45 min | 30-90 min | 2-4 h | 30-60 min |
Participantsdifferent | 1-10 | 3-12 | 2-6 | 2-10 |
Formatsame | Workshop + async | Workshop + async | Workshop + async | Workshop + async |
Outputdifferent | Behavior Over Time Graph, Trend Hypotheses, Key Events | Postmortem Doc, Action Items, Timeline | Barrier Inventory, Failure Analysis per Barrier, Action Backlog | Iceberg Worksheet, Pattern Notes, Intervention Ideas |
Tagsno overlap | Systems thinkingPatternsDynamics | Site Reliability EngineeringIncidentLearningReliability | Root causeSafetyIncident | Systems thinkingRoot causePatterns |