View methods side by side.
Choose up to four methods. Add them using the search and share the comparison by copying its link.
Selected:Behavior Over Time GraphArchitecture Decision RecordC4 ModelArchitecture Communication Canvas
| Criterion |  Systems Thinking Behavior Over Time Graph |  Architecture Architecture Decision Record | 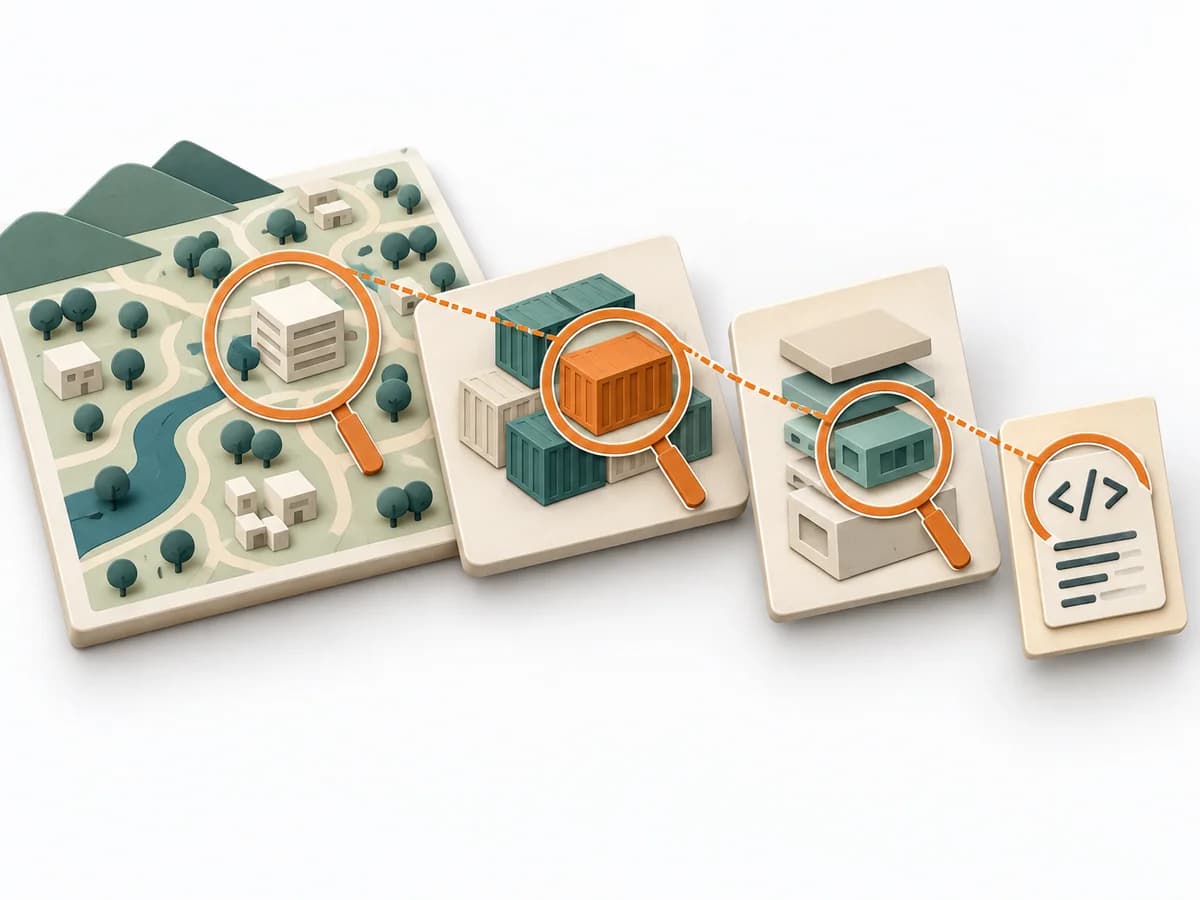 Architecture C4 Model |  Architecture Architecture Communication Canvas |
|---|---|---|---|---|
Purposedifferent | A Behavior Over Time Graph shows how a metric or observation develops over time. The method makes trends, breaks, and recurring patterns visible that get lost in snapshots. | An ADR permanently records an architecture decision with context, trade-offs, and consequence. It creates continuity for later changes because the decision path stays traceable. | The C4 Model makes a system legible across several resolution levels, from context down to code. It suits situations where different audiences need to understand the same architecture from different altitudes. | The Architecture Communication Canvas plans architecture communication so the right people receive the right message. The method turns technical complexity into deliberate communication design. |
Complexitydifferent | Low | Low | Low | Medium |
Timedifferent | 20-45 min | 15-45 min | 1-4 h | 60-120 min |
Participantsdifferent | 1-10 | 1-3 | 1-5 | 2-8 |
Formatdifferent | Workshop + async | Async | Workshop + async | Workshop + async |
Outputdifferent | Behavior Over Time Graph, Trend Hypotheses, Key Events | ADR File, Decision Log, Rationale | Context Diagram, Container Diagram, Component Diagram | Communication Canvas, Stakeholder Messages, Architecture Communication Plan |
Tagsno overlap | Systems thinkingPatternsDynamics | ArchitectureRationaleDocumentationGovernance | ArchitectureCommunicationVisualization | ArchitectureCommunicationStakeholdersCanvas |