View methods side by side.
Choose up to four methods. Add them using the search and share the comparison by copying its link.
| Criterion | 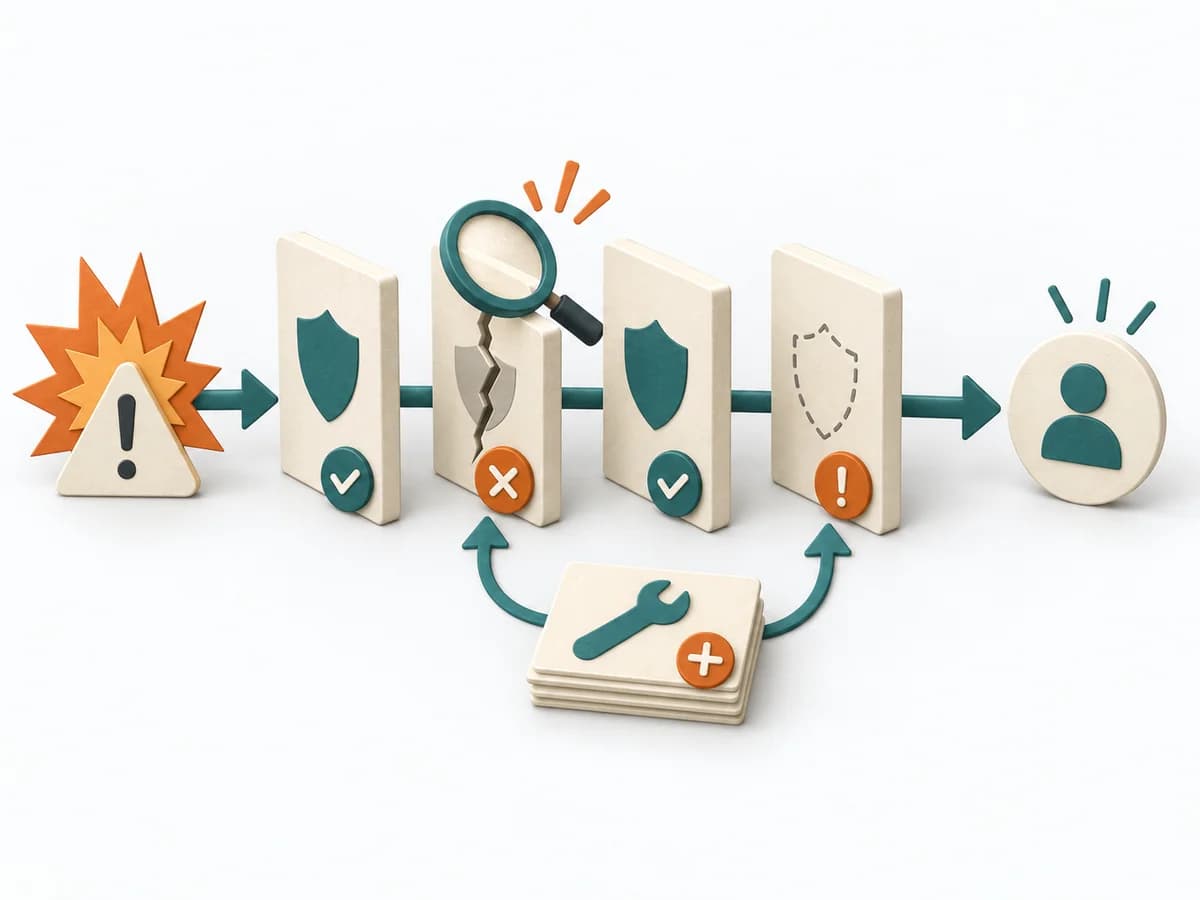 Operations Barrier Analysis |  Systems Thinking Behavior Over Time Graph | 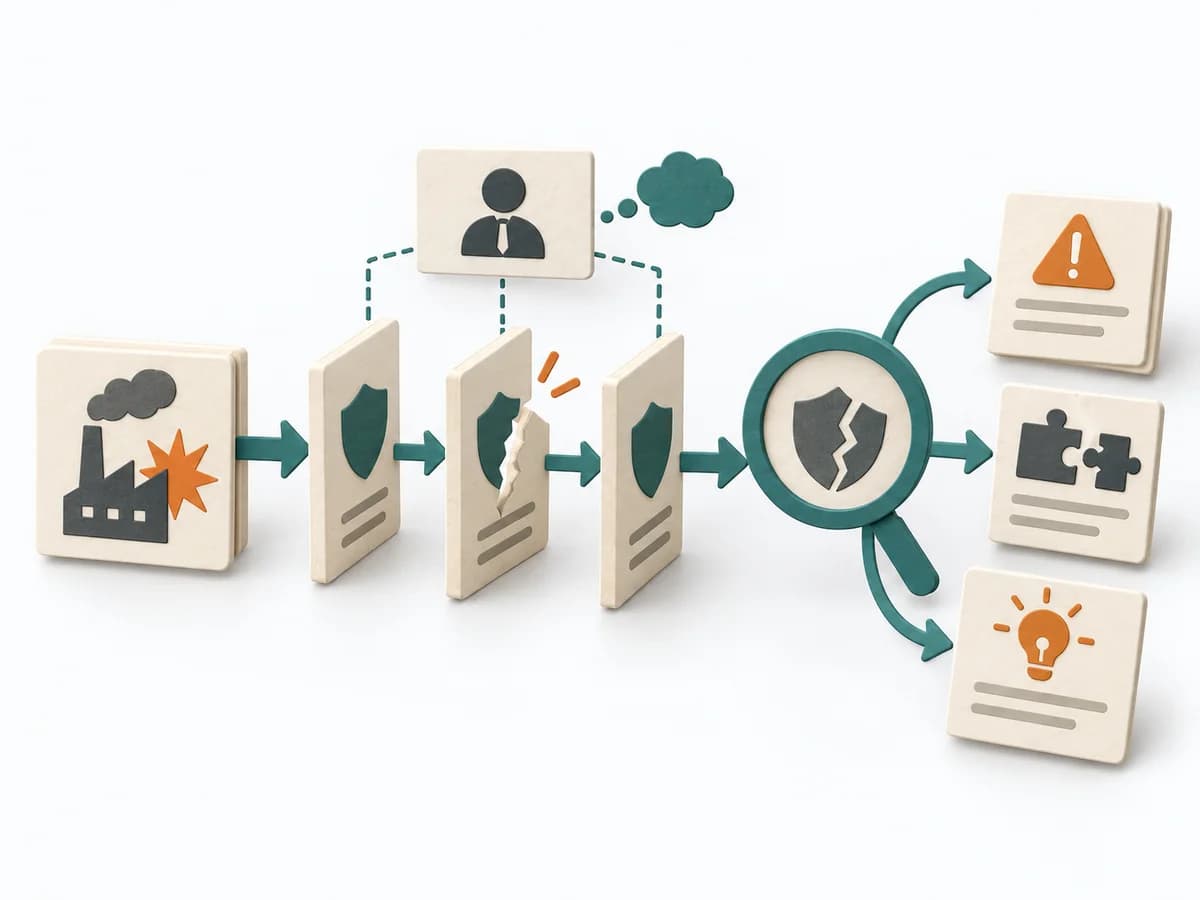 Operations MORT Analysis |  Operations 5 Whys |
|---|---|---|---|---|
Purposedifferent | For a risk that can only be managed through multiple layers of protection, the method examines the effectiveness of each barrier. It shows where safeguards are missing, too weak, or fail under real conditions. | A Behavior Over Time Graph shows how a metric or observation develops over time. The method makes trends, breaks, and recurring patterns visible that get lost in snapshots. | For a safety-relevant event or a system with high protection requirements, the method examines where controls failed. It exposes both technical and organizational gaps. | For a single, hard-to-explain deviation, the method exposes the causal chain behind the visible symptom. It keeps the cause open until a controllable condition emerges instead of a mere description. |
Complexitydifferent | Medium | Low | High | Low |
Timedifferent | 2-4 h | 20-45 min | Mehrere Tage bis Wochen | 15-30 min |
Participantsdifferent | 2-6 | 1-10 | 2-6 | 2-6 |
Formatdifferent | Workshop + async | Workshop + async | Workshop + async | Workshop |
Outputdifferent | Barrier Inventory, Failure Analysis per Barrier, Action Backlog | Behavior Over Time Graph, Trend Hypotheses, Key Events | MORT Worksheets, Findings per Branch, Corrective Actions, Systemic Recommendations | Root cause notes, Countermeasures |
Tagsno overlap | Root causeSafetyIncident | Systems thinkingPatternsDynamics | Root causeSafetySystemicIncident | Root causeIncidentLeanProblem solving |