View methods side by side.
Choose up to four methods. Add them using the search and share the comparison by copying its link.
| Criterion |  Architecture ATAM (Architecture Tradeoff Analysis Method) |  Operations Kepner-Tregoe | 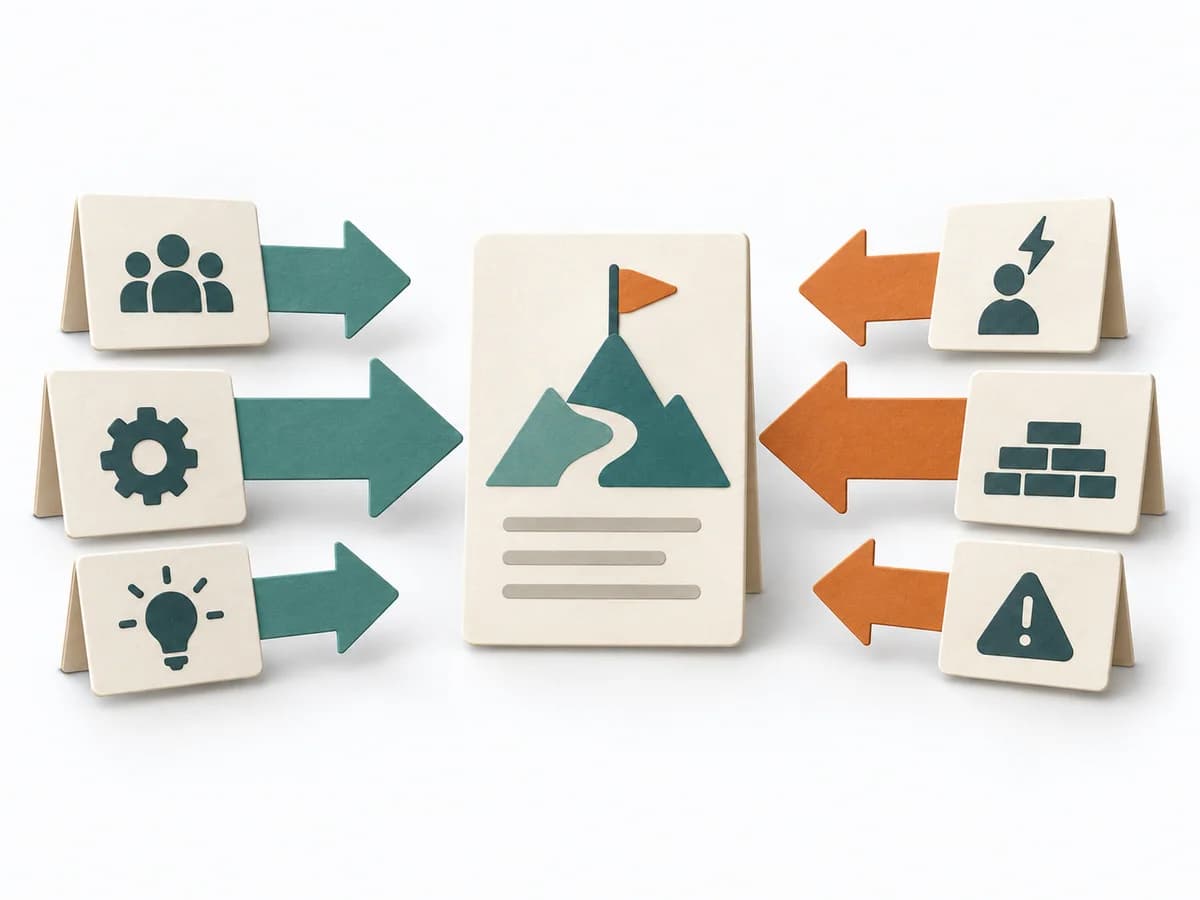 Decision Making Force Field Analysis |
|---|---|---|---|
Purposedifferent | ATAM helps teams weigh architecture decisions when quality goals compete. The team considers business goals, stakeholder expectations, and technical decisions together. The evaluation shows which risks need further investigation. | For a disturbance that's hard to pin down, the method cleanly separates problem, cause, and decision. It reduces mixing when symptoms allow several interpretations. | In change initiatives, supporting and restraining forces sit at the table at the same time. Force Field Analysis makes these tensions explicit and shows where change can be pushed forward by strengthening or relieving. |
Complexitydifferent | High | High | Low |
Timedifferent | Several meetings plus preparation and analysis; total effort depends on scope | 2-8 h | 45-90 min |
Participantsdifferent | Evaluation team, architects, and relevant stakeholders | 2-8 | 3-12 |
Formatdifferent | Workshop + async | Workshop + async | Workshop |
Outputdifferent | Prioritized quality scenarios in a utility tree, Architecture risks with reasoning and assumptions, Sensitivity and trade-off points, Findings report with open investigations | Problem Analysis, Decision Analysis, Risk Plan | Force Field Map, Change Levers, Risk Notes |
Tagsno overlap | ArchitectureQualityRiskTradeoffsStakeholders | Problem solvingRoot causeDecisionOperations | ChangeDecisionStrategy |
Often compared together
Methods with strong topical overlap with the current selection, not yet in the comparison.