View methods side by side.
Choose up to four methods. Add them using the search and share the comparison by copying its link.
| Criterion | 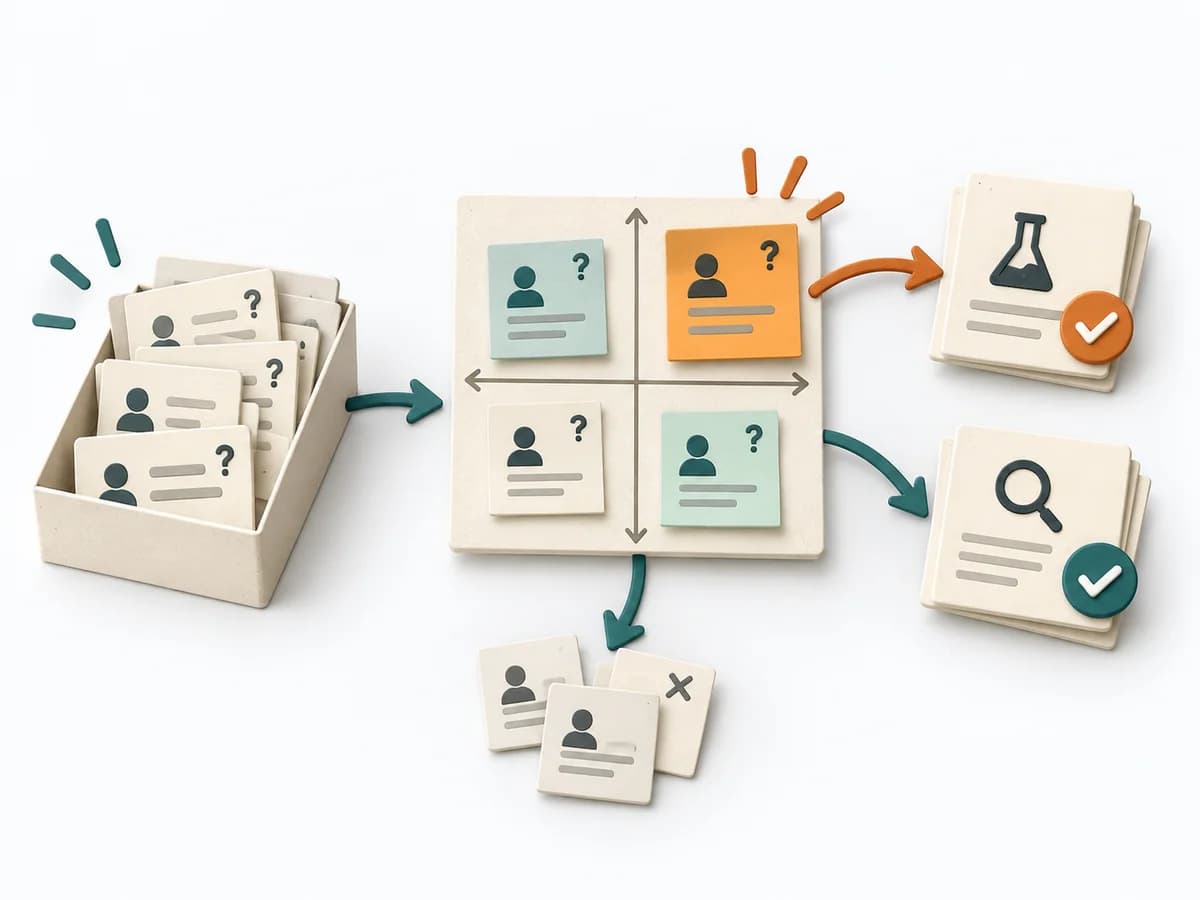 Decision Making Assumption Surfacing |  Systems Thinking Behavior Over Time Graph | 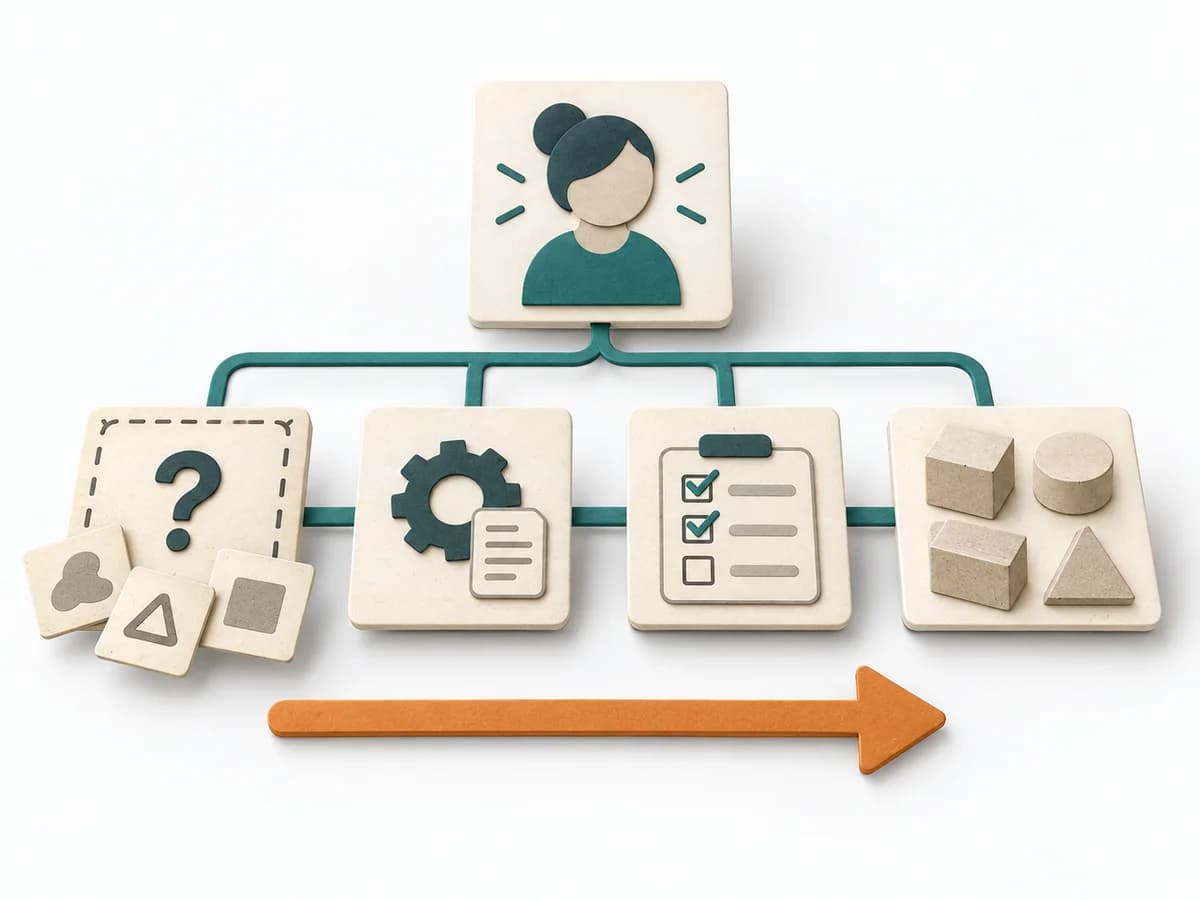 Systems Thinking Wardley Mapping |  Product Discovery Assumption Mapping |
|---|---|---|---|---|
Purposedifferent | Plans often contain assumptions that were never openly stated and remain dangerous precisely because of that. Assumption Surfacing makes these silent premises visible and prioritizes which of them carry the initiative or could sink it. | A Behavior Over Time Graph shows how a metric or observation develops over time. The method makes trends, breaks, and recurring patterns visible that get lost in snapshots. | Wardley Mapping makes visible where an offering stands today and where it can evolve. The method connects user need, value chain, and evolution stages into a strategic basis for platform, build, or buy decisions. | When assumptions still sit unordered in the room, it weighs uncertainty against leverage. It makes visible which hypotheses should be checked first. |
Complexitydifferent | Low | Low | Medium | Medium |
Timedifferent | 45-90 min | 20-45 min | 1-3 h | 45-60 min |
Participantsdifferent | 2-8 | 1-10 | 2-10 | 2-8 |
Formatsame | Workshop + async | Workshop + async | Workshop + async | Workshop + async |
Outputdifferent | Assumption List, Critical Assumptions, Learning Plan | Behavior Over Time Graph, Trend Hypotheses, Key Events | Wardley Map, Strategic Options, Evolution Notes | Assumption map, Test backlog, Risk ranking |
Tagsno overlap | AssumptionsRiskDecisionDiscovery | Systems thinkingPatternsDynamics | StrategySystems thinkingDynamics | AssumptionsRiskExperimentsValidation |