View methods side by side.
Choose up to four methods. Add them using the search and share the comparison by copying its link.
| Criterion |  Operations ALPEN Method |  Facilitation Dot Estimation |  Operations Failure Mode and Effects Analysis |
|---|---|---|---|
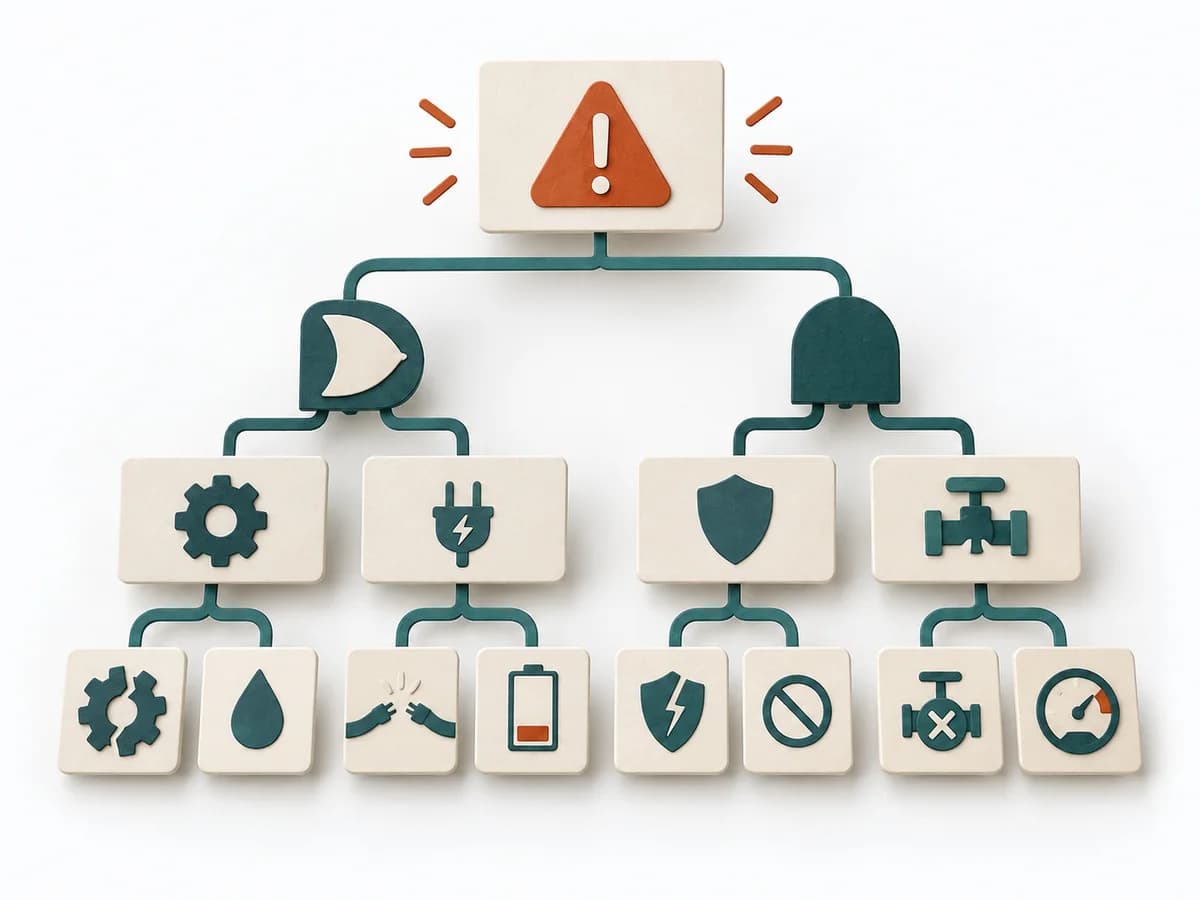
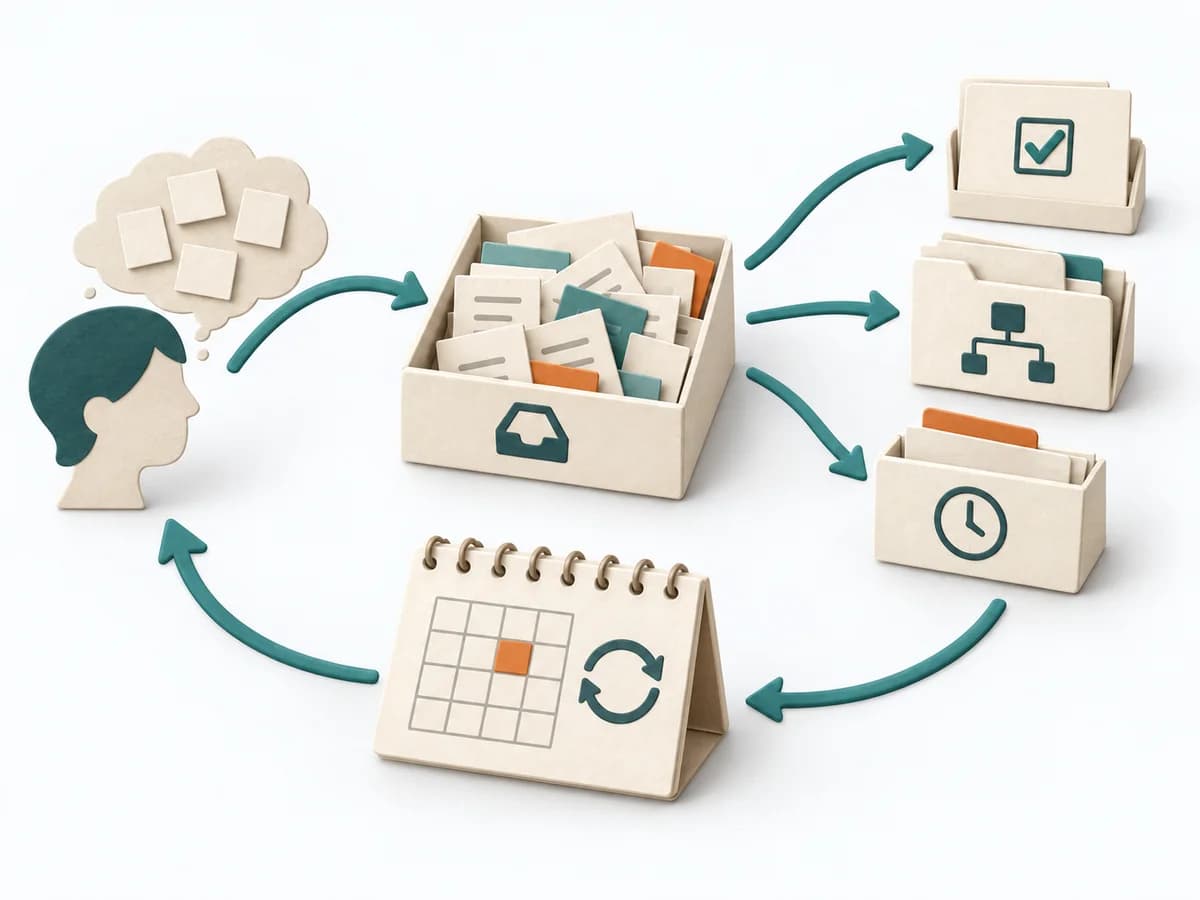
Purposedifferent | With an overloaded day full of too many tasks, a realistic picture of the day emerges. The method connects estimating, deciding, and buffer thinking so planning fits available energy and time. | When size or effort can only be estimated roughly, Dot Estimation condenses the group's experience into a quick range. It turns individual contributions into a visible selection. The result is captured as an Effort Heatmap, Risk Signals, and Discussion Targets. | For a process, product, or service with noticeable failure risks, the method assesses possible failure modes in advance. It directs attention to combinations of occurrence, effect, and detectability. |
Complexitydifferent | Low | Low | High |
Timedifferent | 10-20 min daily | 5-20 min | 2-6 h |
Participantsdifferent | 1 | 3-20 | 3-10 |
Formatdifferent | Async | Workshop | Workshop |
Outputdifferent | Daily Plan, Time Estimates, Review Notes | Effort Heatmap, Risk Signals, Discussion Targets | FMEA Table, Risk Priority, Mitigation Actions |
Tagsno overlap | PlanningTime managementProductivityOperations | EstimationEffortRisk | RiskQualityOperationsRoot cause |
Often compared together
Methods with strong topical overlap with the current selection, not yet in the comparison.