View methods side by side.
Choose up to four methods. Add them using the search and share the comparison by copying its link.
| Criterion | 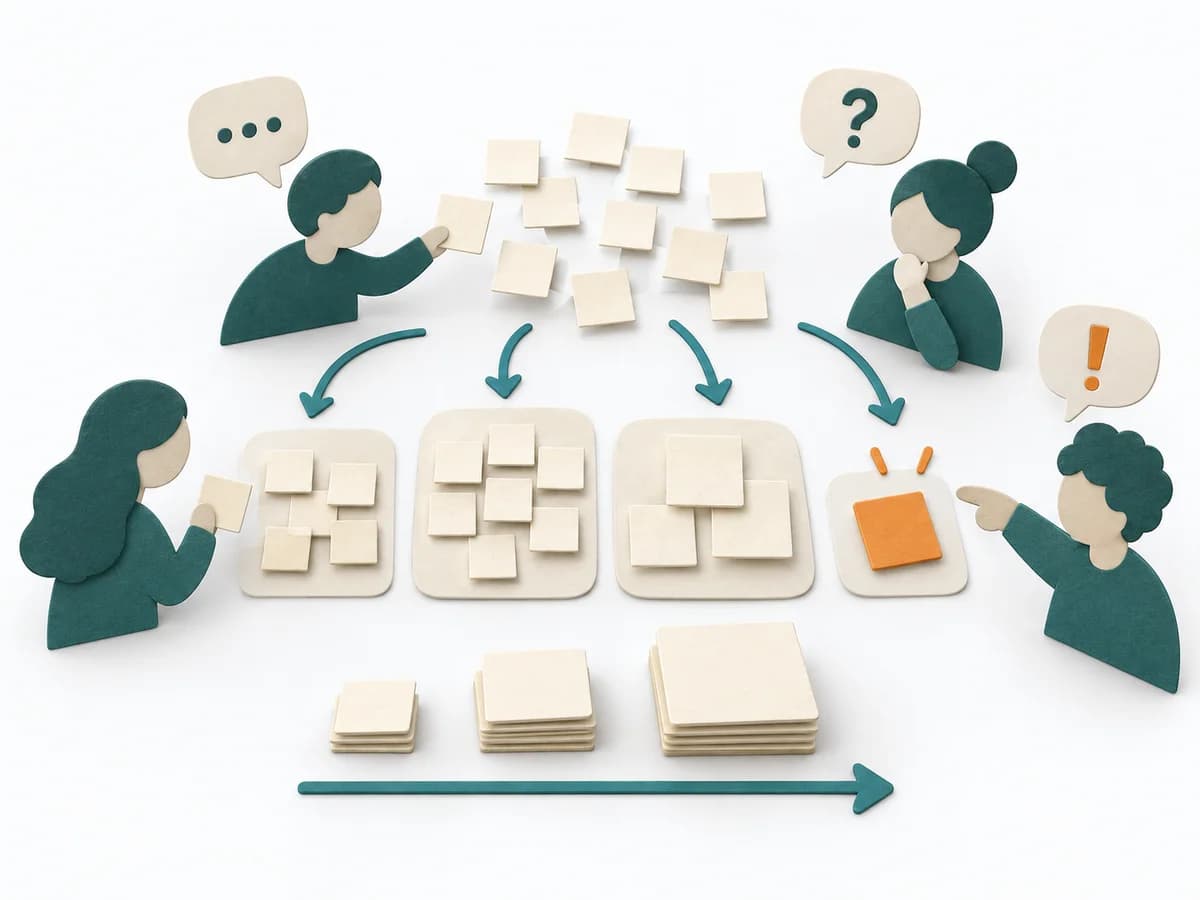 Agile Affinity Estimation |  Delivery Value Stream Mapping | 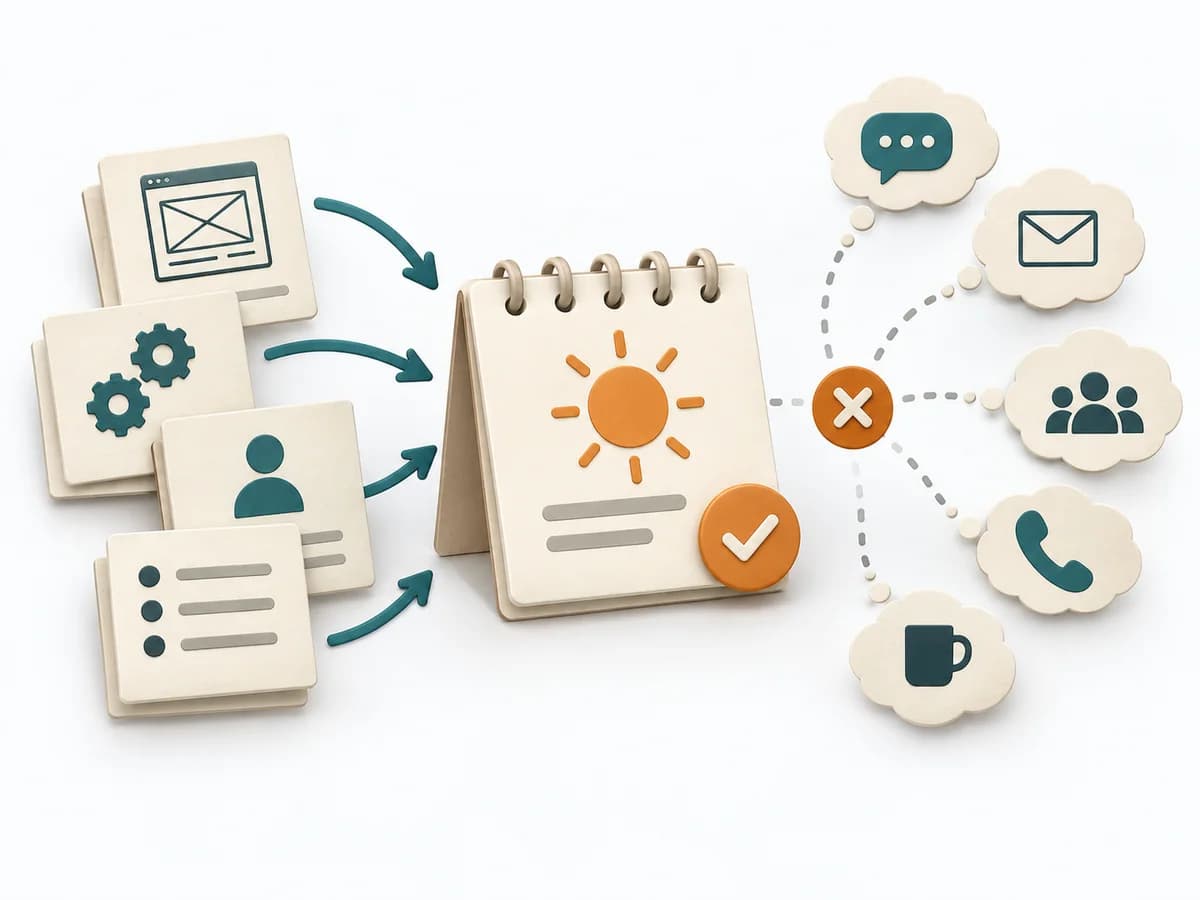 Agile Ideal Days | 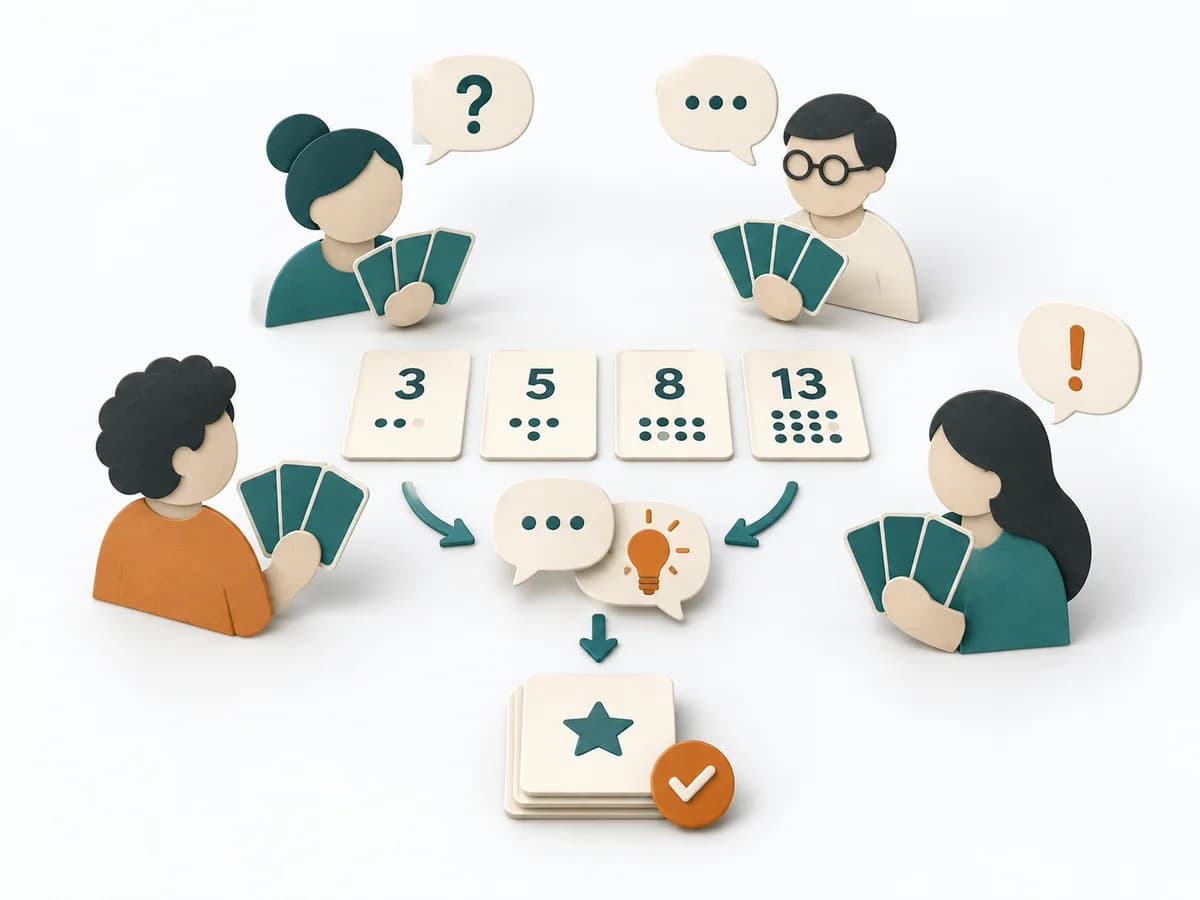 Agile Planning Poker |
|---|---|---|---|---|
Purposedifferent | When many tasks need to be classified quickly, it sorts them by perceived effort and similarity. It reduces the effort of fine-grained estimation for large volumes. | When delivery work dissolves into wait times, handoffs, and hidden effort, Value Stream Mapping makes the actual flow visible. The method exposes bottlenecks, idle time, and feedback loops so lead time and improvement levers become tangible. | When effort needs to be thought of as real working time, it offers a simple common denominator for comparison. It sorts work by value, risk, and delivery ability. The result is captured as Ideal Day Estimates, Assumption Notes, and Capacity Caveats. | When estimates within the team diverge too much, it puts differing expectations on a common test bench. It separates rough complexity from unspoken assumptions. |
Complexitydifferent | Medium | Medium | Low | Low |
Timedifferent | 30-90 min | 1-3 h | 15-60 min | 2-5 min je Item |
Participantsdifferent | 3-12 | 4-10 | 2-9 | 3-9 |
Formatdifferent | Workshop | Workshop | Workshop + async | Workshop + async |
Outputdifferent | Affinity Size Map, Grouped Estimates, Unclear Items | Current-state map, Future-state map, Bottleneck list | Ideal Day Estimates, Assumption Notes, Capacity Caveats | Relative Estimates, Assumption Notes, Split Candidates |
Tagsno overlap | EstimationBacklogRelative sizing | LeanFlowWasteDelivery | EstimationEffortAgile | EstimationAgileRelative sizingTeam |