View methods side by side.
Choose up to four methods. Add them using the search and share the comparison by copying its link.
| Criterion | 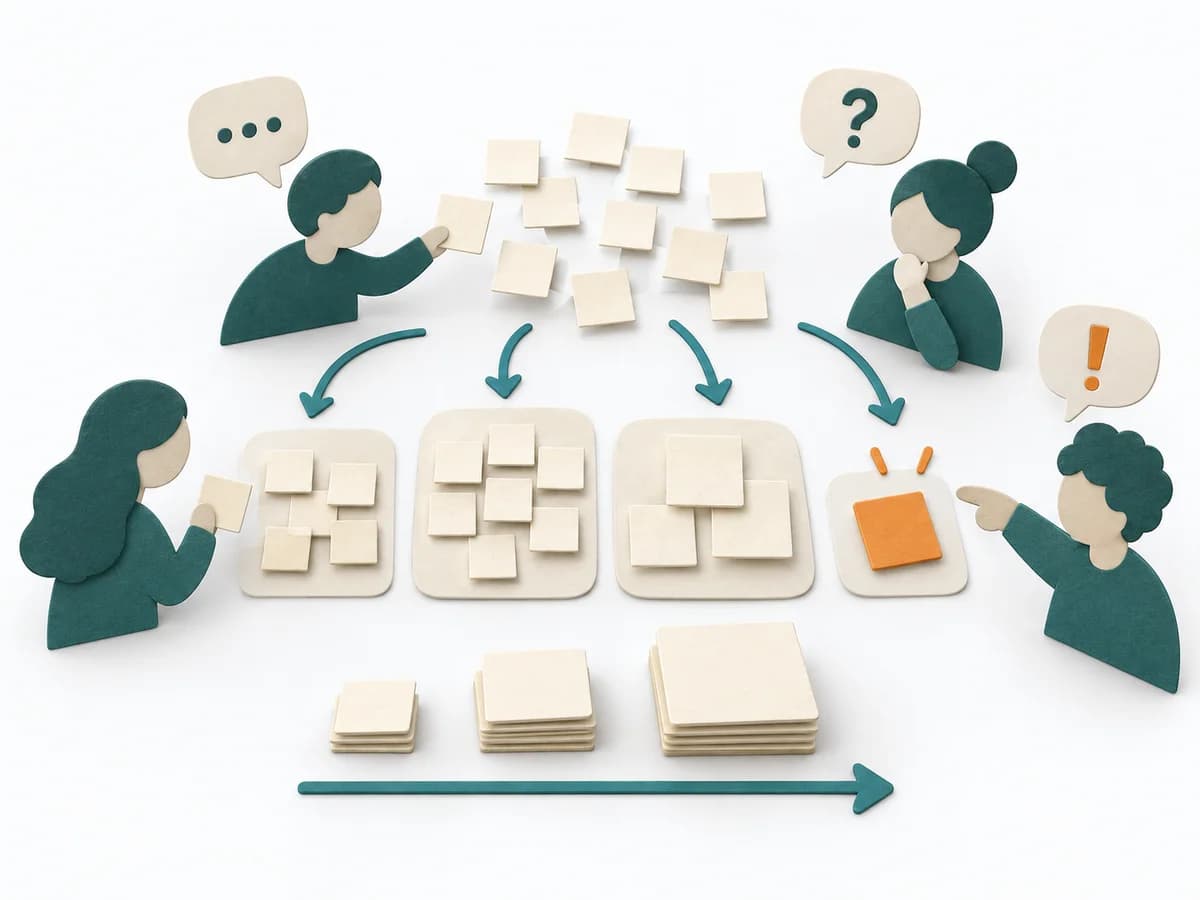 Agile Affinity Estimation | 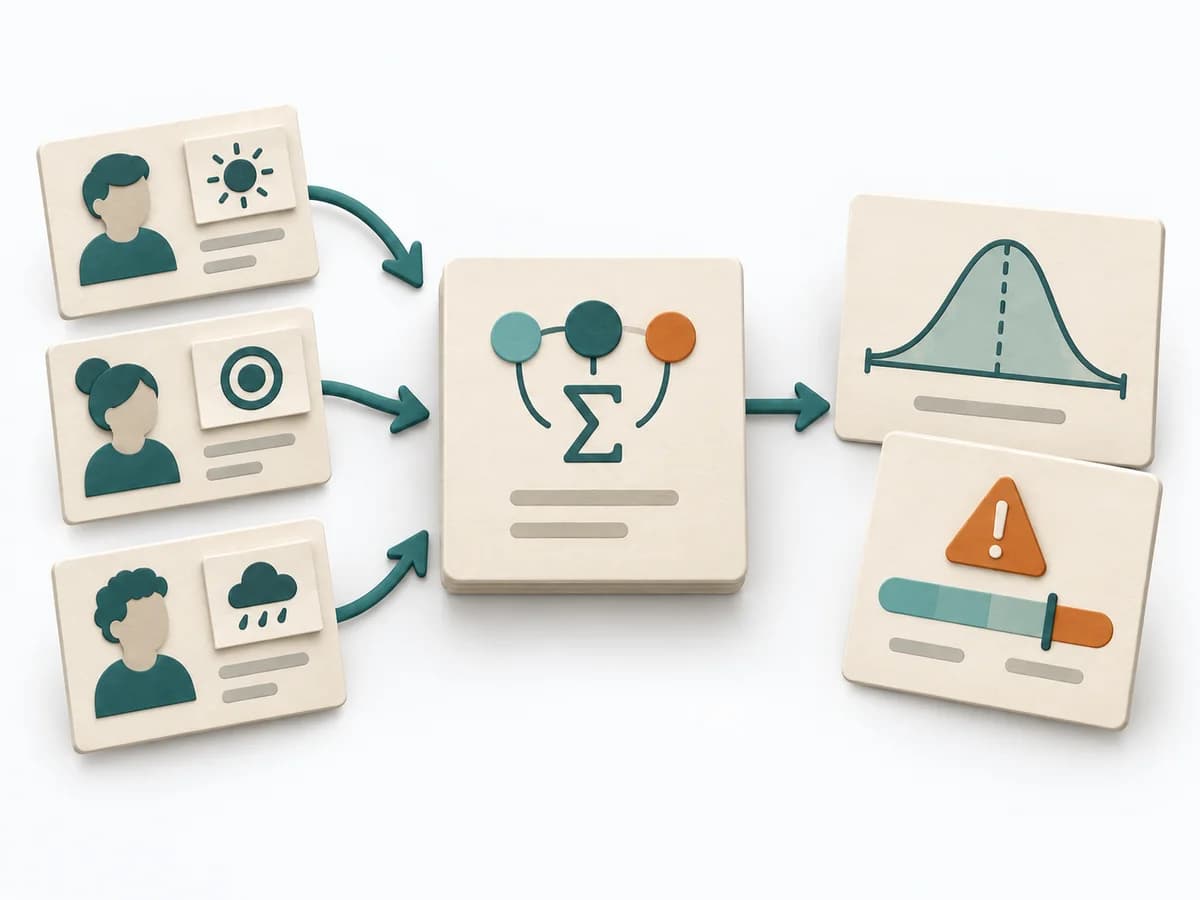 Decision Making PERT Estimation |  Product Discovery Opportunity Scoring | 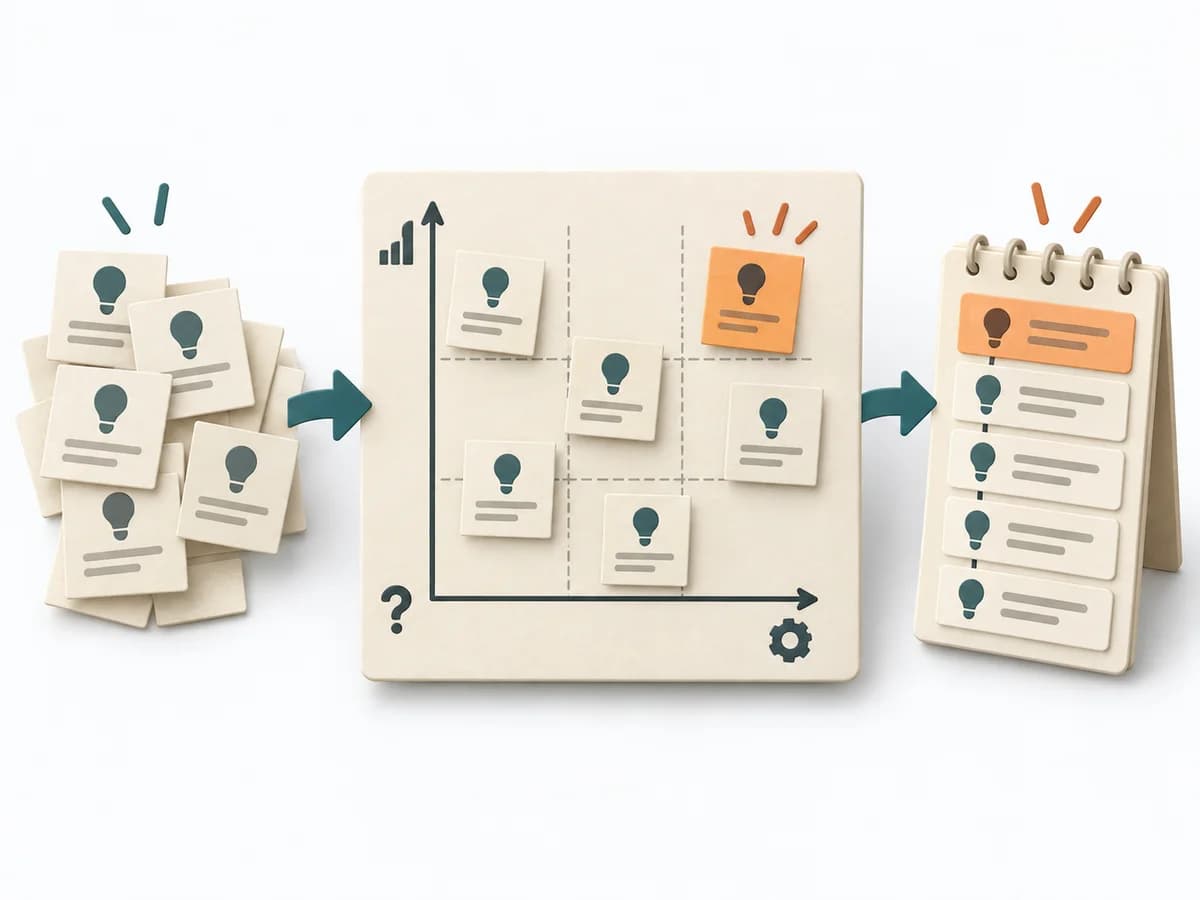 Product Discovery Hypothesis Prioritization Canvas |
|---|---|---|---|---|
Purposedifferent | When many tasks need to be classified quickly, it sorts them by perceived effort and similarity. It reduces the effort of fine-grained estimation for large volumes. | On complex initiatives, a plain average tends to understate just how uncertain the outcome really is. It separates options, evaluation criteria, and open risks. The result is captured as a PERT Estimate, Expected Value, and Risk Notes. | When opportunities need ranking by their effect, it makes importance and satisfaction directly comparable. It separates problem, assumption, solution, and evidence. The result is captured as an opportunity-score table and top outcomes. | When many hypotheses compete for attention, it brings order to their learning sequence and importance. It separates problem, assumption, solution, and evidence. The result is captured as a prioritization canvas and a hypothesis backlog. |
Complexitysame | Medium | Medium | Medium | Medium |
Timedifferent | 30-90 min | 15-45 min | 60-120 min | 60-90 min |
Participantsdifferent | 3-12 | 1-8 | 3-6 | 3-8 |
Formatdifferent | Workshop | Workshop + async | Workshop + async | Workshop |
Outputdifferent | Affinity Size Map, Grouped Estimates, Unclear Items | PERT Estimate, Expected Value, Risk Notes | Opportunity Score Table, Top Outcomes | Prioritization Canvas, Hypothesis Backlog |
Tagsno overlap | EstimationBacklogRelative sizing | EstimationUncertaintyRisk | PrioritizationDiscoveryOutcomesNeeds | ExperimentsPrioritizationDiscoveryHypothesis |