View methods side by side.
Choose up to four methods. Add them using the search and share the comparison by copying its link.
| Criterion | 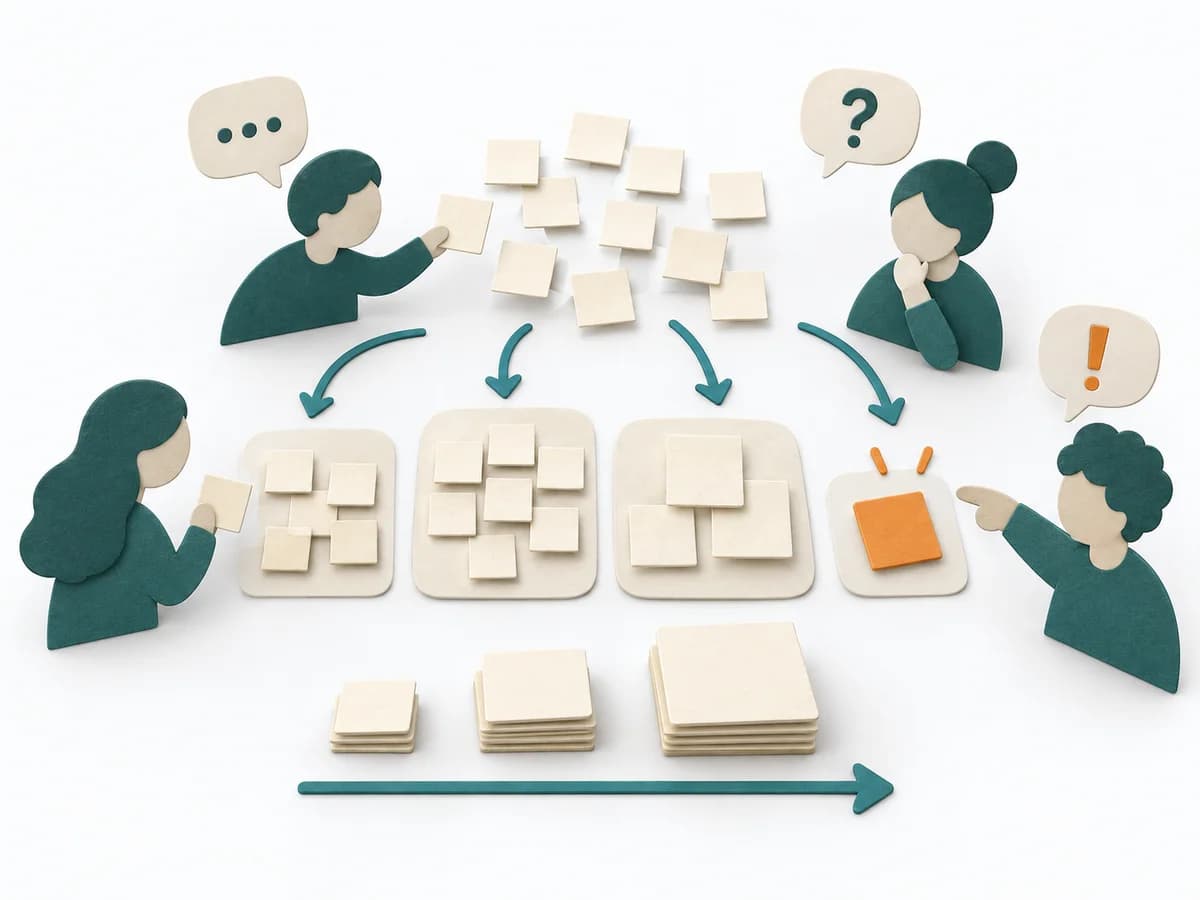 Agile Affinity Estimation | 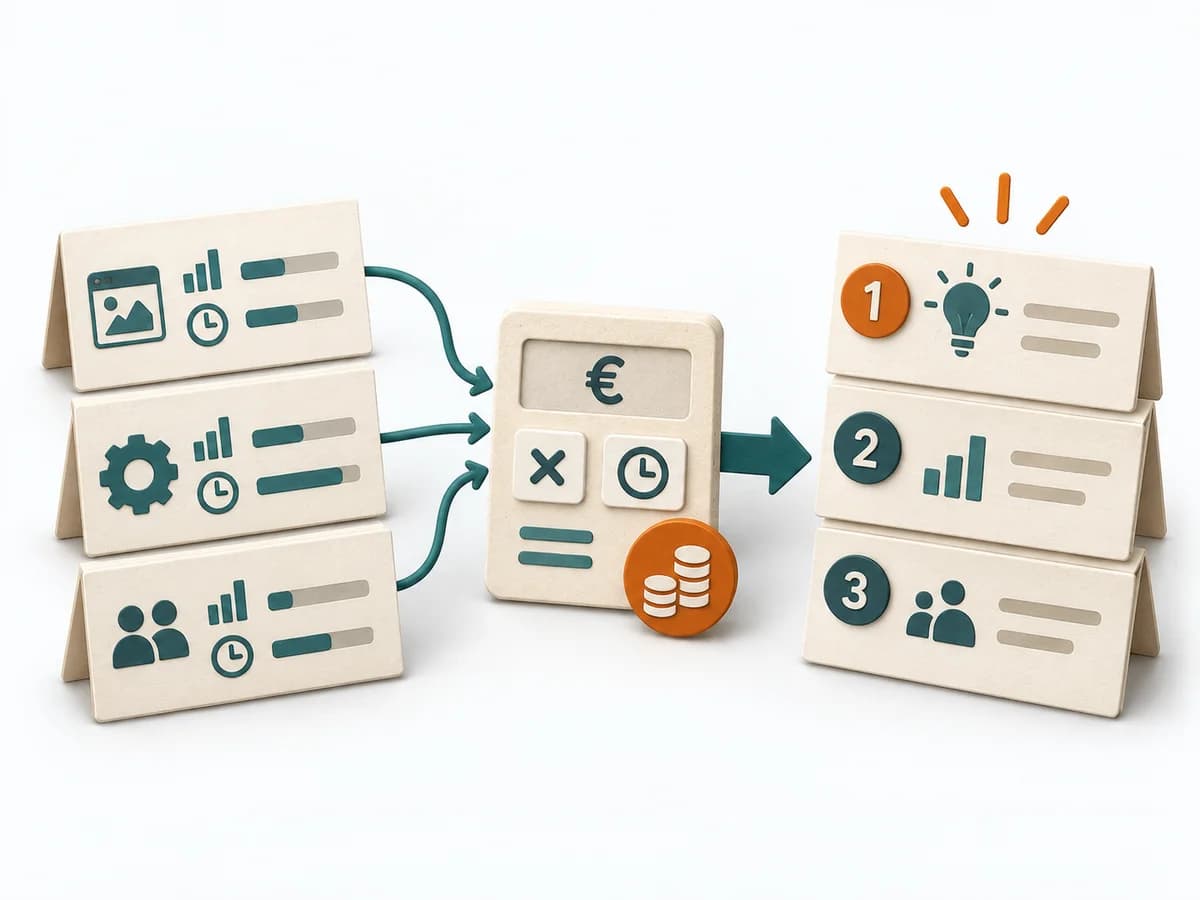 Delivery Cost of Delay |  Decision Making OODA Loop | 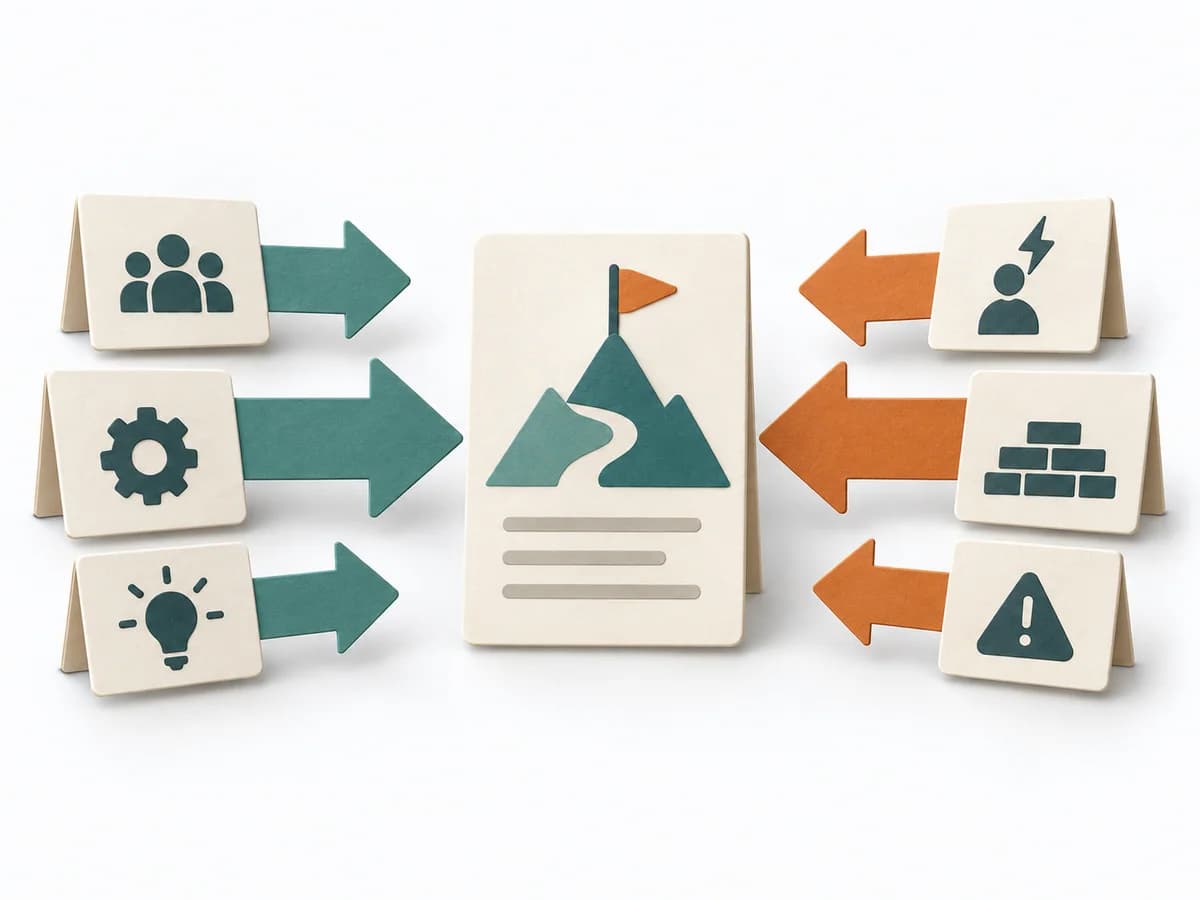 Decision Making Force Field Analysis |
|---|---|---|---|---|
Purposedifferent | When many tasks need to be classified quickly, it sorts them by perceived effort and similarity. It reduces the effort of fine-grained estimation for large volumes. | Helps clarify scope, order, and delivery flow in concrete terms. It makes work, constraints, and sequence manageable. The result is captured as a Cost of Delay table and prioritization sequence. | In dynamic situations, decisions become outdated faster than they can be prepared. The OODA Loop holds observing, orienting, deciding, and acting together as a recurring rhythm so reaction does not slide into inertia. | In change initiatives, supporting and restraining forces sit at the table at the same time. Force Field Analysis makes these tensions explicit and shows where change can be pushed forward by strengthening or relieving. |
Complexitydifferent | Medium | High | Medium | Low |
Timedifferent | 30-90 min | 90-180 min | 15-60 min je Zyklus | 45-90 min |
Participantsdifferent | 3-12 | 3-8 | 1-8 | 3-12 |
Formatdifferent | Workshop | Workshop | Workshop + async | Workshop |
Outputdifferent | Affinity Size Map, Grouped Estimates, Unclear Items | CoD Table, Prioritization Sequence | Situation Assessment, Decision Loop, Action Updates | Force Field Map, Change Levers, Risk Notes |
Tagsno overlap | EstimationBacklogRelative sizing | PrioritizationDeliveryEconomicsDecision | DecisionChangeLearningStrategy | ChangeDecisionStrategy |