View methods side by side.
Choose up to four methods. Add them using the search and share the comparison by copying its link.
| Criterion |  Operations ABC Analysis |  UX Design Service Blueprinting | 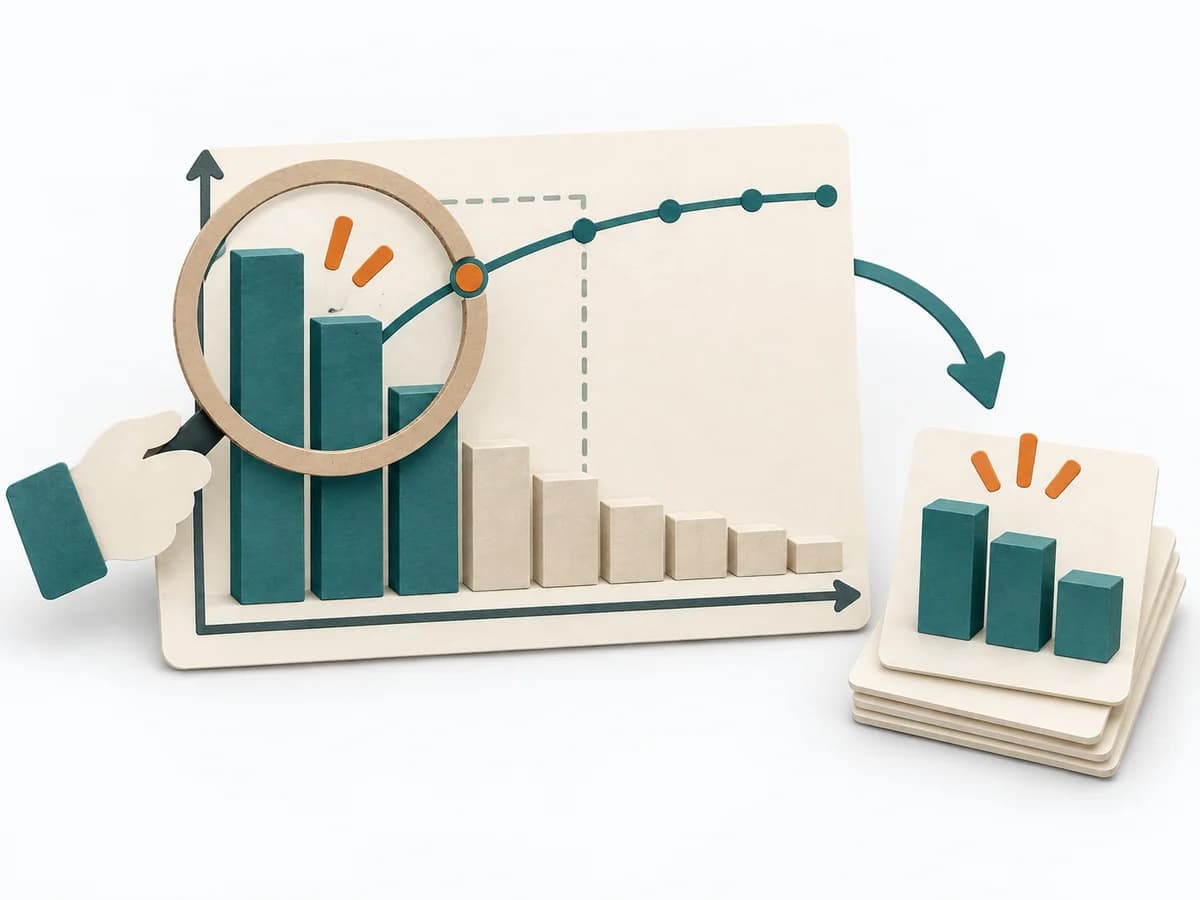 Decision Making Pareto Analysis |
|---|---|---|---|
Purposedifferent | With many similar objects of differing economic significance, the method prioritizes effort by effect. It separates what needs regular steering from what rarely needs attention. | When a service experience is spread across several touchpoints, it brings frontstage and backstage together. It shows where user contact and internal responsibility must fit. | In many problem situations, effect is distributed unequally across many causes. A Pareto Analysis separates the few drivers with high leverage from the long remainder and focuses attention on what measurably moves the needle. |
Complexitydifferent | Low | High | Low |
Timedifferent | 30-60 min | 0.5-2 Tage | 30-60 min |
Participantsdifferent | 1-5 | 6-12 | 1-6 |
Formatdifferent | Async | Workshop | Workshop + async |
Outputdifferent | ABC Classification, Focus Rules, Control List | Service Blueprint, Fail Points, Ownership Map | Pareto Chart, Top Causes, Focus List |
Tagsno overlap | PrioritizationOperationsPortfolio | Service designOperationsJourneyBlueprint | PrioritizationQualityFocusRoot cause |
Often compared together
Methods with strong topical overlap with the current selection, not yet in the comparison.



