View methods side by side.
Choose up to four methods. Add them using the search and share the comparison by copying its link.
| Criterion |  Operations ABC Analysis | 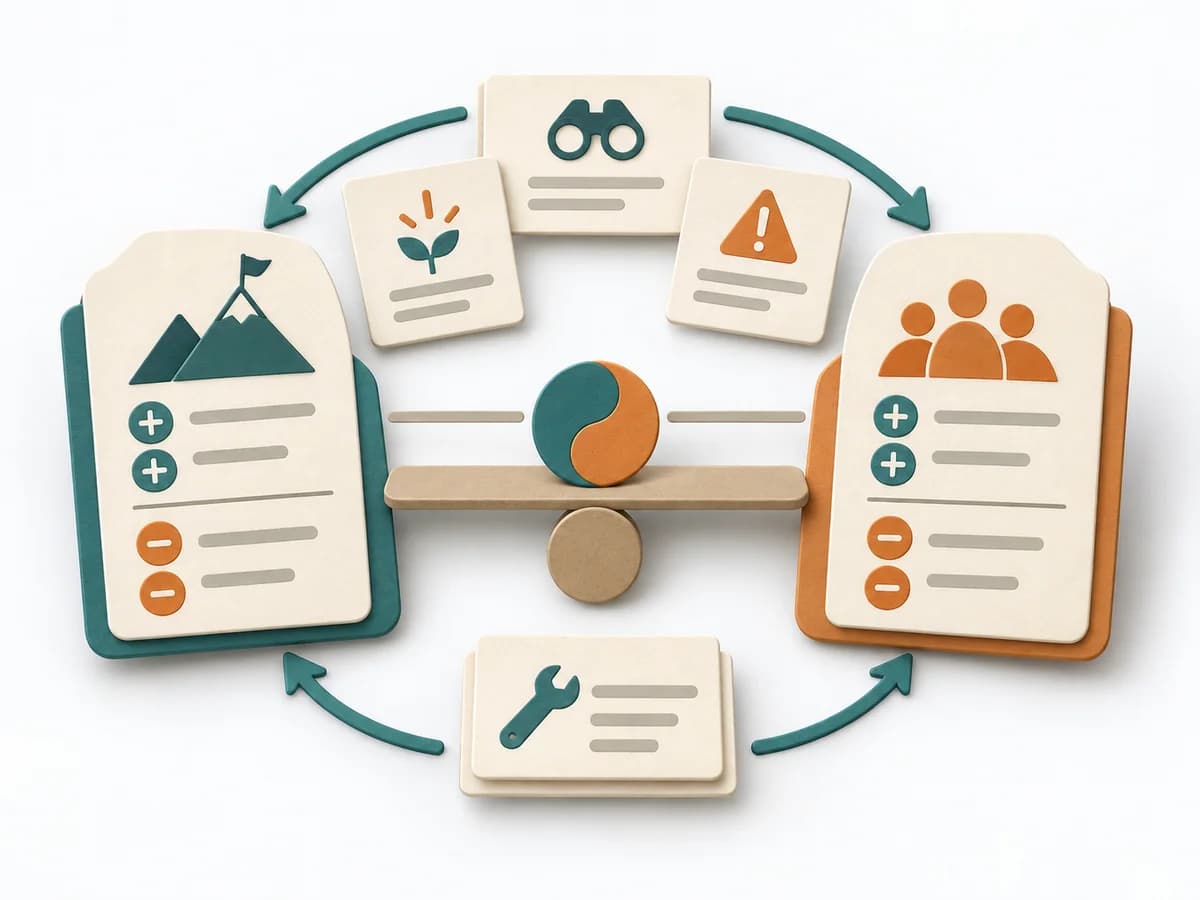 Systems Thinking Polarity Mapping |  Operations Process Mapping |  Product Strategy RICE Scoring |
|---|---|---|---|---|
Purposedifferent | With many similar objects of differing economic significance, the method prioritizes effort by effect. It separates what needs regular steering from what rarely needs attention. | Polarity Mapping makes tensions between two opposing poles tangible, such as standardization and adaptation or control and autonomy. The method guards against making apparent either-or decisions prematurely. | With a confusing workflow that has many handoffs, the method makes the actual process visible. It shows where work is passed on, delayed, or duplicated, so improvement targets the right spots. | When many initiatives compete for the same resources, it brings reach, impact, confidence, and effort into one shared ranking. It makes prioritization economically connectable. |
Complexitydifferent | Low | Medium | Medium | Medium |
Timedifferent | 30-60 min | 1-2 h | 1-3 h | 60-90 min |
Participantsdifferent | 1-5 | 3-12 | 3-10 | 2-10 |
Formatdifferent | Async | Workshop | Workshop | Workshop + async |
Outputdifferent | ABC Classification, Focus Rules, Control List | Polarity Map, Warning Signs, Balance Actions | Process Map, Handoff List, Improvement Backlog | RICE Scores, Ranked List, Assumption Log |
Tagsno overlap | PrioritizationOperationsPortfolio | Systems thinkingTradeoffsLeadership | ProcessOperationsImprovement | PrioritizationScoringRoadmapTradeoffs |