View methods side by side.
Choose up to four methods. Add them using the search and share the comparison by copying its link.
Selected:ABC AnalysisFailure Mode and Effects AnalysisLASR (Lightweight Approach for Software Reviews)
| Criterion |  Operations ABC Analysis |  Operations Failure Mode and Effects Analysis | 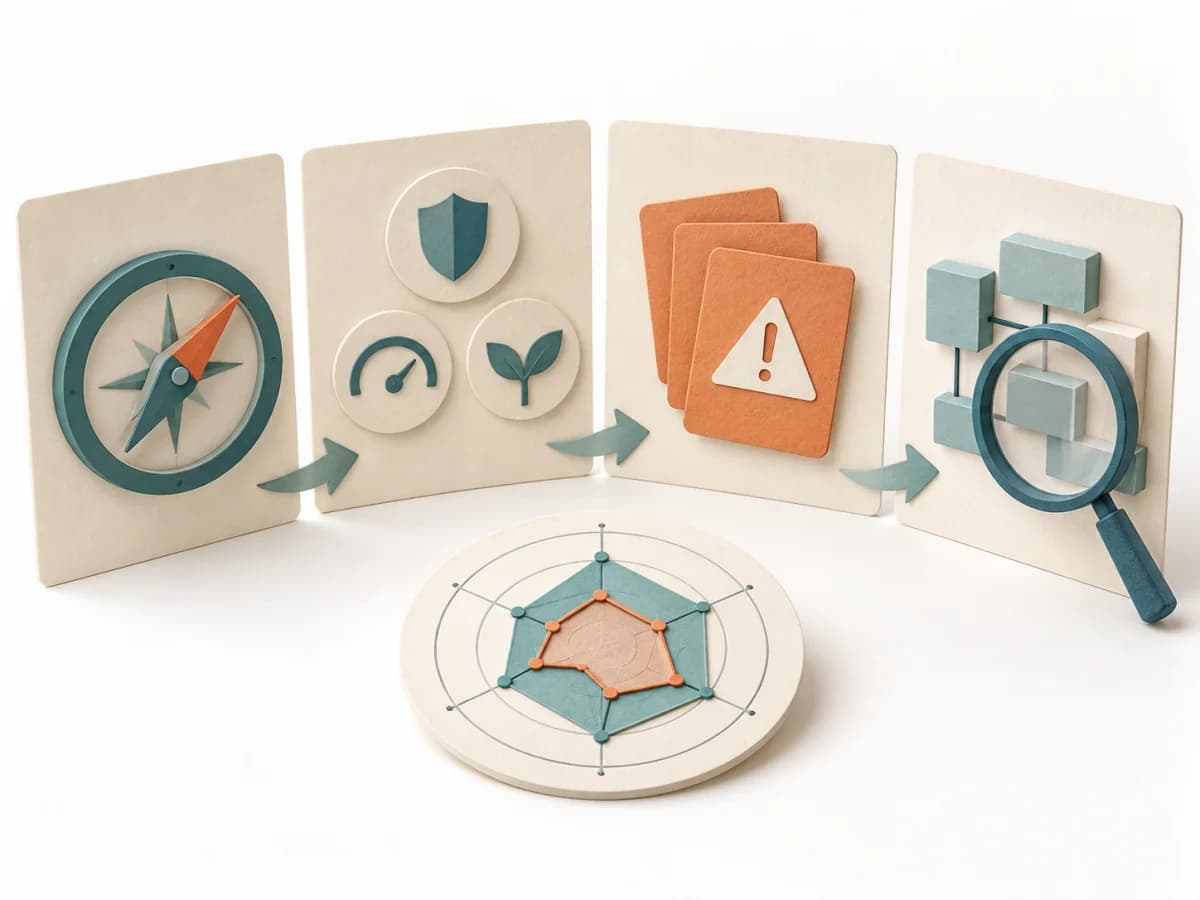 Architecture LASR (Lightweight Approach for Software Reviews) |
|---|---|---|---|
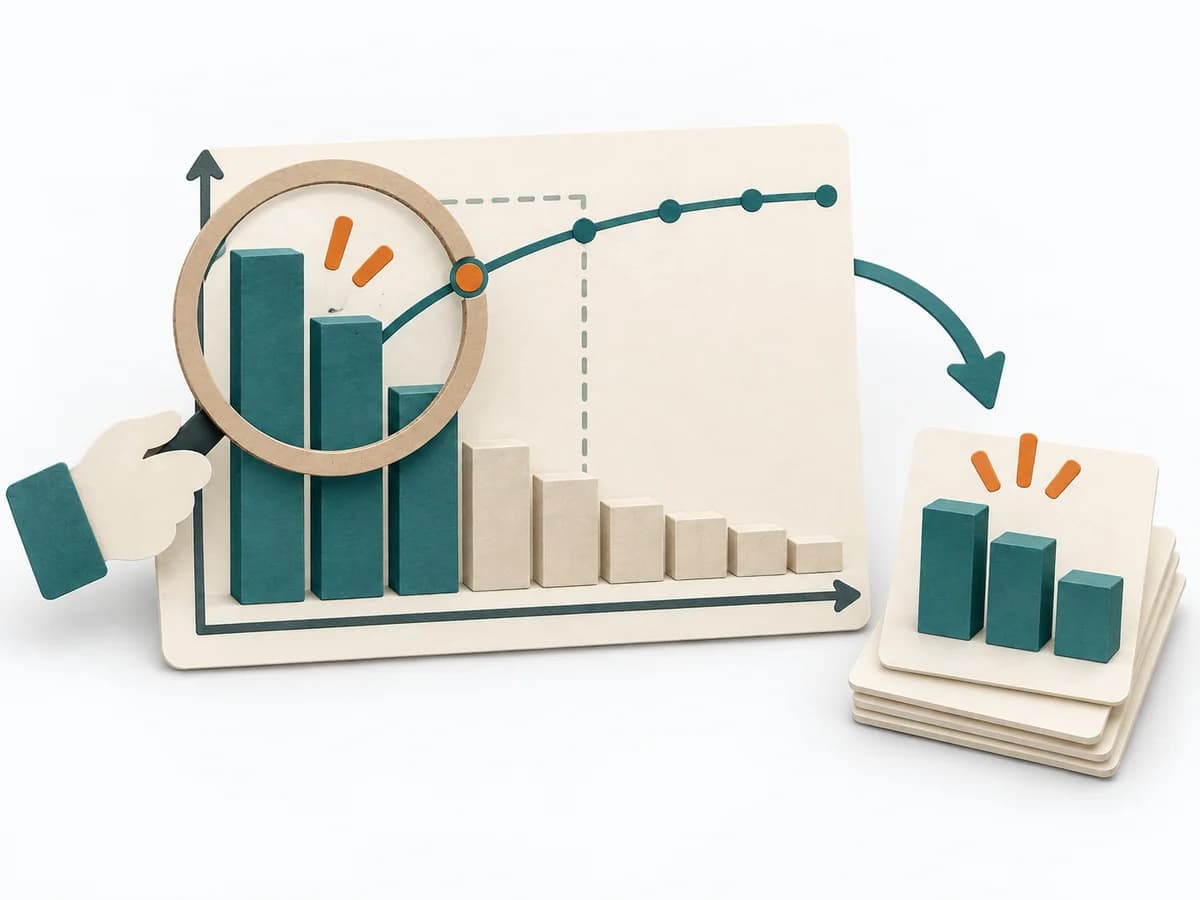
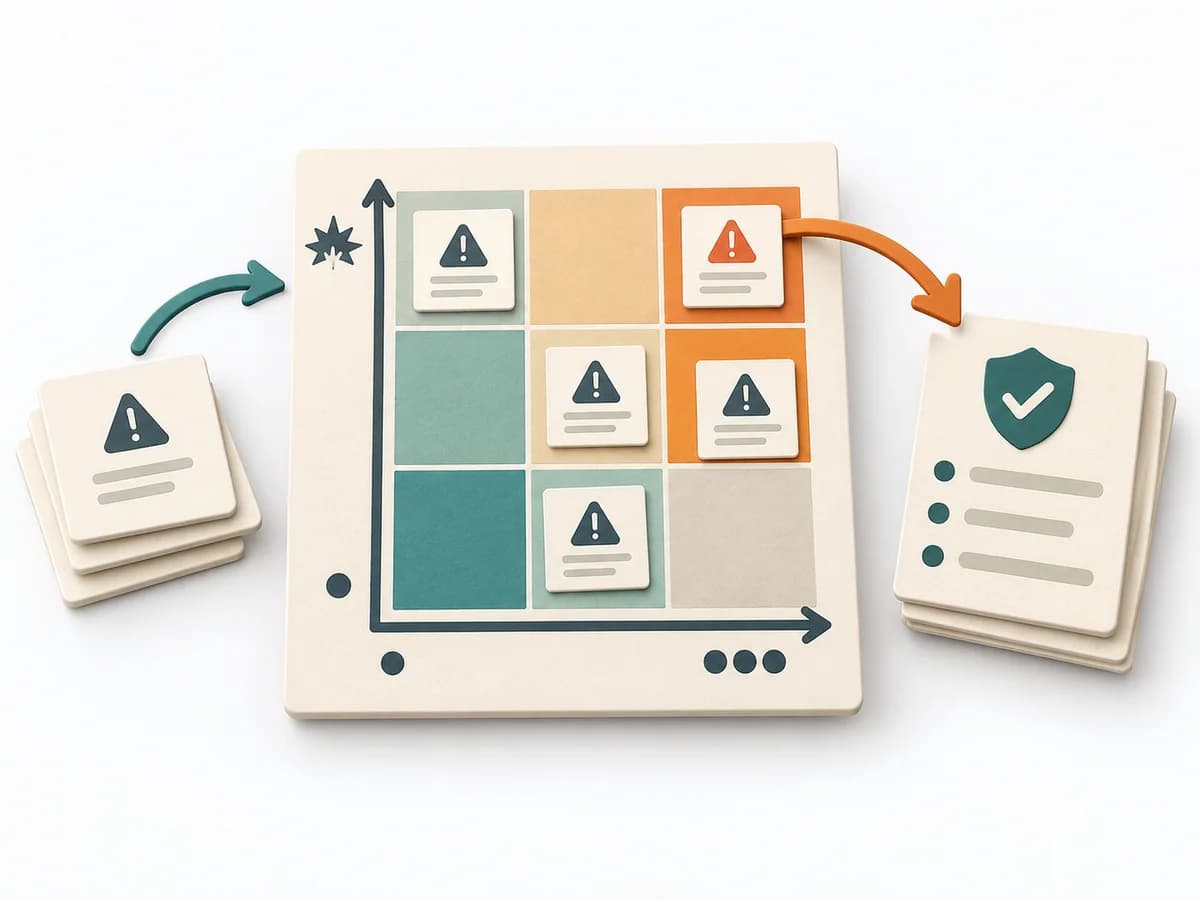
Purposedifferent | With many similar objects of differing economic significance, the method prioritizes effort by effect. It separates what needs regular steering from what rarely needs attention. | For a process, product, or service with noticeable failure risks, the method assesses possible failure modes in advance. It directs attention to combinations of occurrence, effect, and detectability. | LASR helps development teams identify where their software falls short of important quality goals and which improvements to consider. A small group with existing system knowledge can make an initial assessment and investigate open questions in more detail. |
Complexitydifferent | Low | High | Medium |
Timedifferent | 30-60 min | 2-6 h | 3–4 h for initial assessment; preparation and deeper analysis additional |
Participantsdifferent | 1-5 | 3-10 | 1 or a small team; particularly suitable for 3–4 people |
Formatdifferent | Async | Workshop | Workshop + async |
Outputdifferent | ABC Classification, Focus Rules, Control List | FMEA Table, Risk Priority, Mitigation Actions | Lean Mission Statement describing the software’s purpose, Prioritized quality goals and evaluation criteria, Risks and estimated gaps against quality goals, More closely examined findings and open checks |
Tagsno overlap | PrioritizationOperationsPortfolio | RiskQualityOperationsRoot cause | ArchitectureQualityRiskAssessmentLean |
Often compared together
Methods with strong topical overlap with the current selection, not yet in the comparison.