View methods side by side.
Choose up to four methods. Add them using the search and share the comparison by copying its link.
| Criterion |  Agile WSJF |  UX Design Storyboarding | 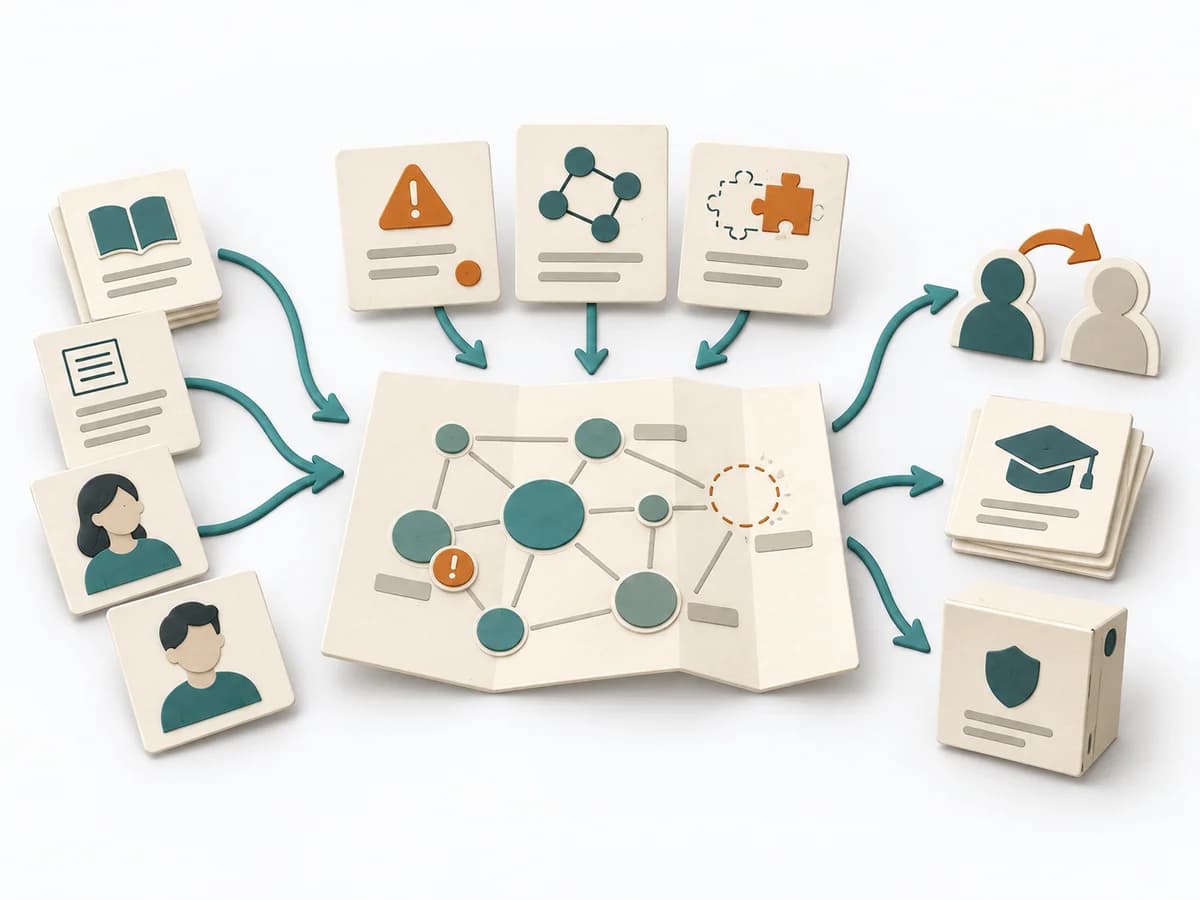 Knowledge Modeling Knowledge Mapping | 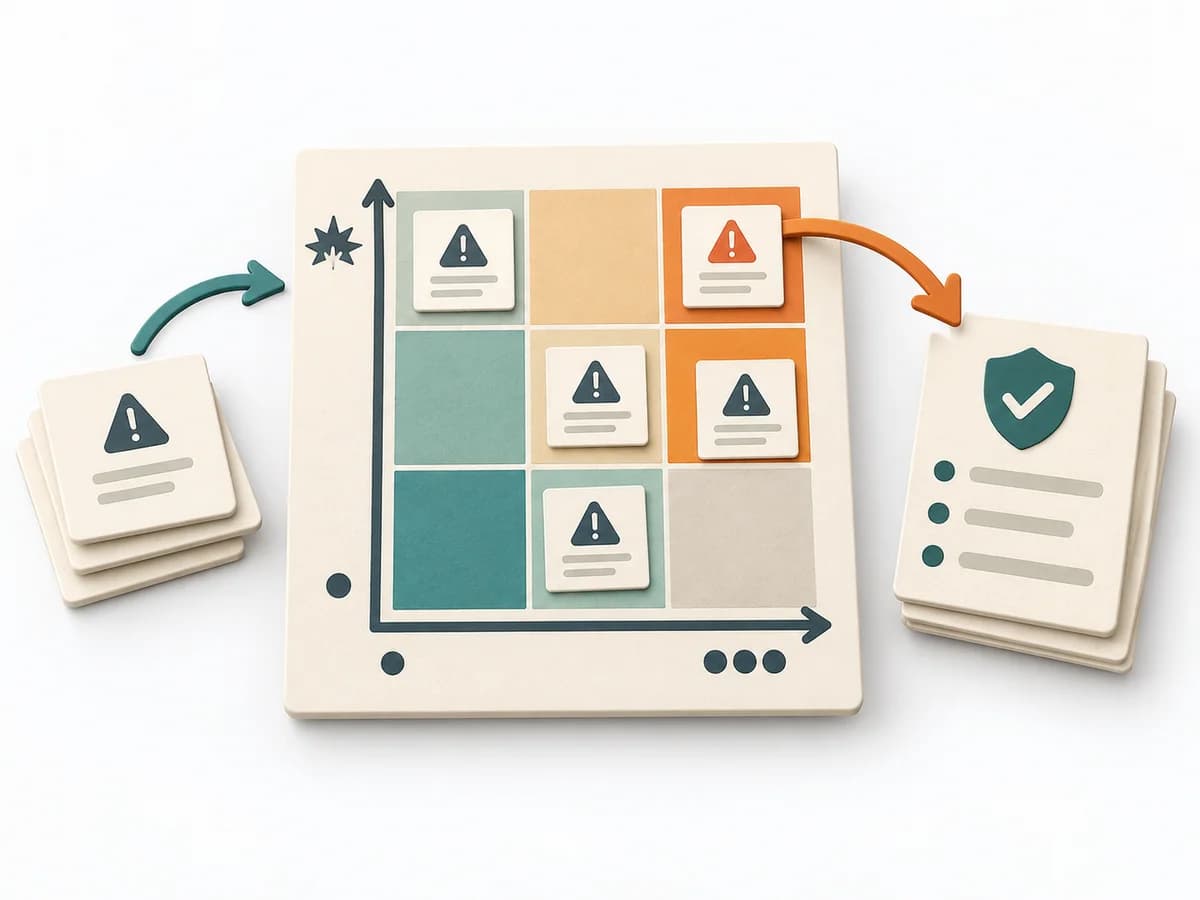 Decision Making Risk Matrix |
|---|---|---|---|---|
Purposedifferent | When many tasks compete for the same capacity, it orders work by economic impact. It makes time lost, benefit, and effort comparable together. | When a usage scenario needs to become understandable early, it condenses situations, context, and flow into a legible sequence. It helps check concept ideas before anything gets built. | Knowledge Mapping makes knowledge, gaps, and transfer paths visible across a field. It fits when expertise should not just exist but also be findable and transferable. | When a project faces many possible disruptions, it quickly becomes unclear which risks deserve attention first. It separates options, evaluation criteria, and open risks. The result is captured as a Risk Matrix and a Top Risk List. |
Complexitydifferent | High | Medium | Medium | Low |
Timedifferent | 45-90 min | 30-90 min | 1-3 h | 30-60 min |
Participantsdifferent | 3-10 | 1-8 | 3-12 | 3-10 |
Formatdifferent | Workshop | Workshop + async | Workshop | Workshop + async |
Outputdifferent | Ranked Backlog, Cost-of-Delay Assumptions | Storyboard, Concept Narrative, Testable Assumptions | Knowledge Map, Critical Knowledge Areas, Transfer Plan | Risk Matrix, Top Risk List |
Tagsno overlap | LeanEconomicsSequencePrioritization | VisualizationConceptsSequencePrototype | KnowledgeMappingRisk | RiskDecisionPrioritizationAssessment |