View methods side by side.
Choose up to four methods. Add them using the search and share the comparison by copying its link.
| Criterion |  Agile WSJF | 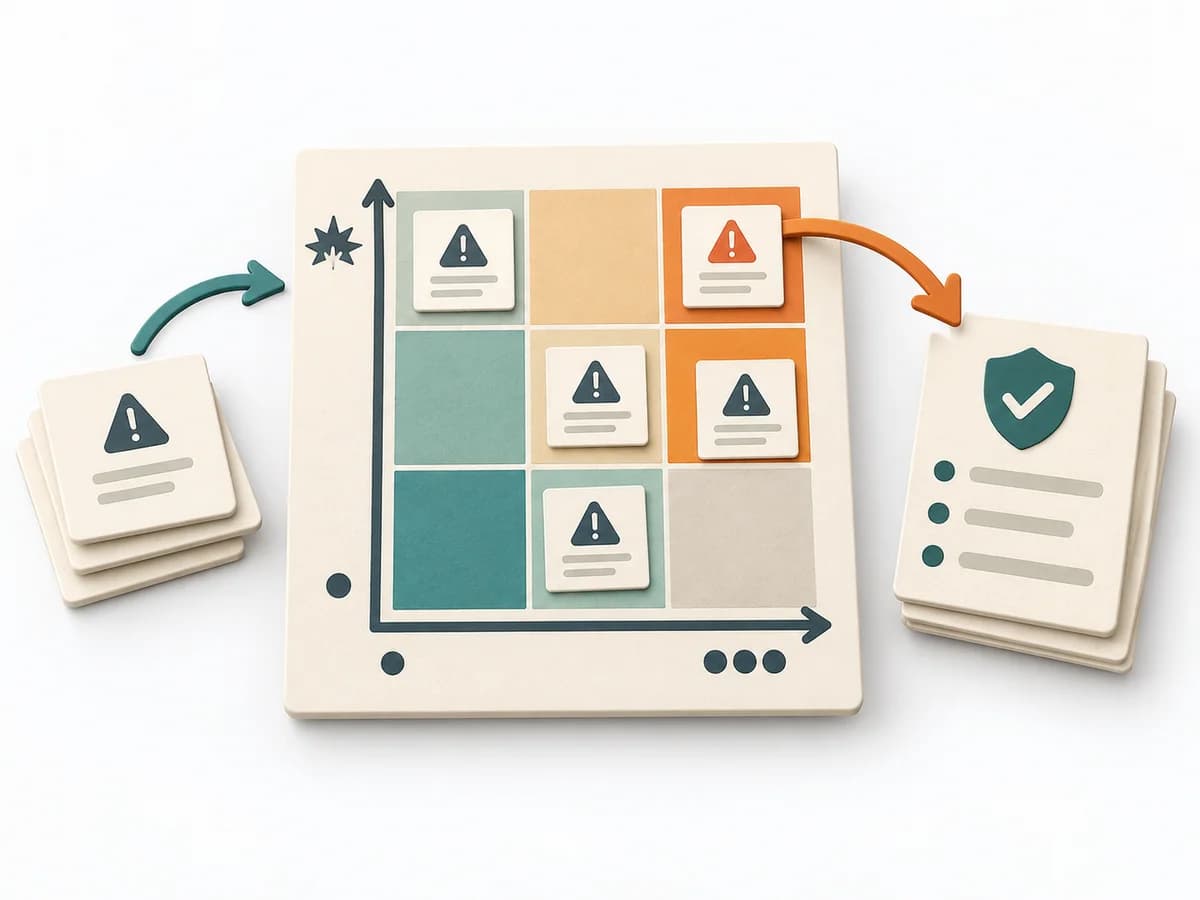 Decision Making Risk Matrix | 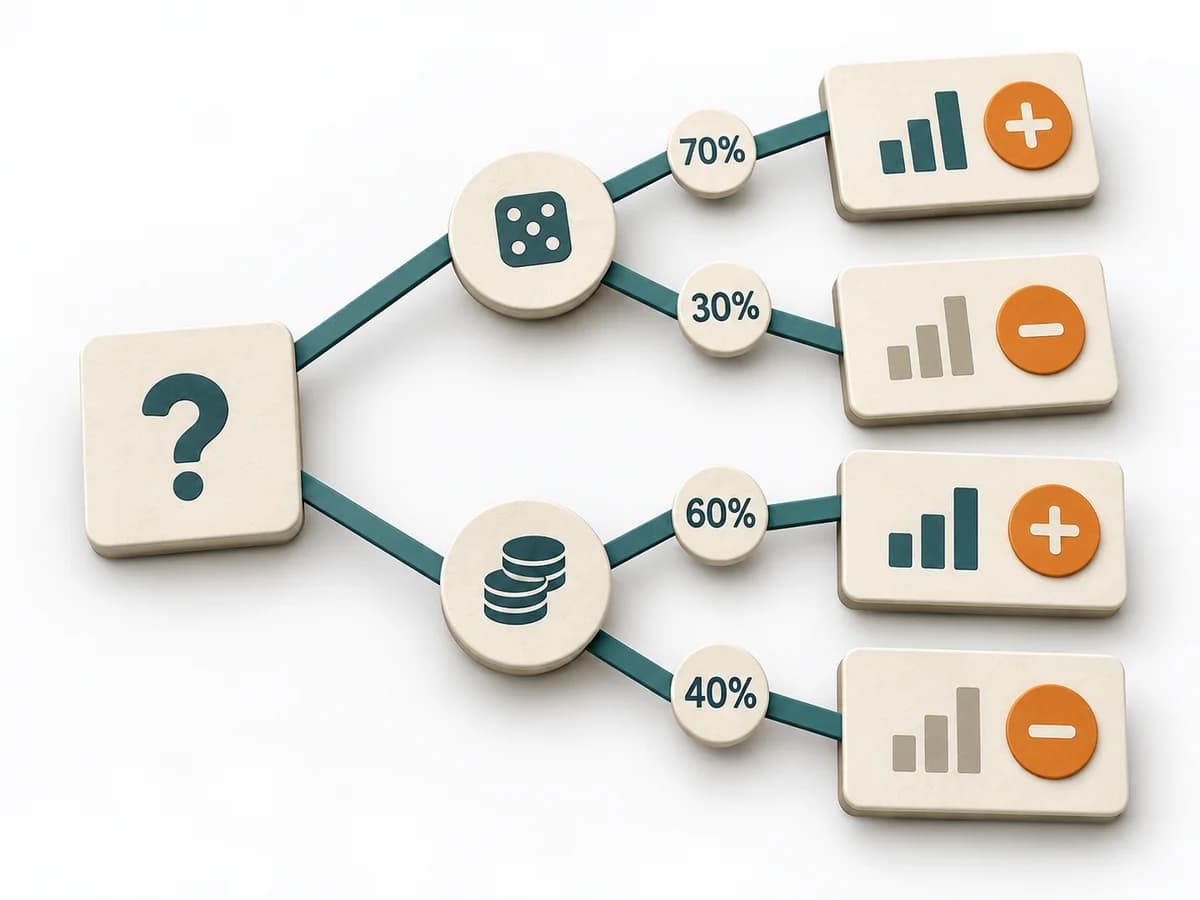 Decision Making Decision Tree | 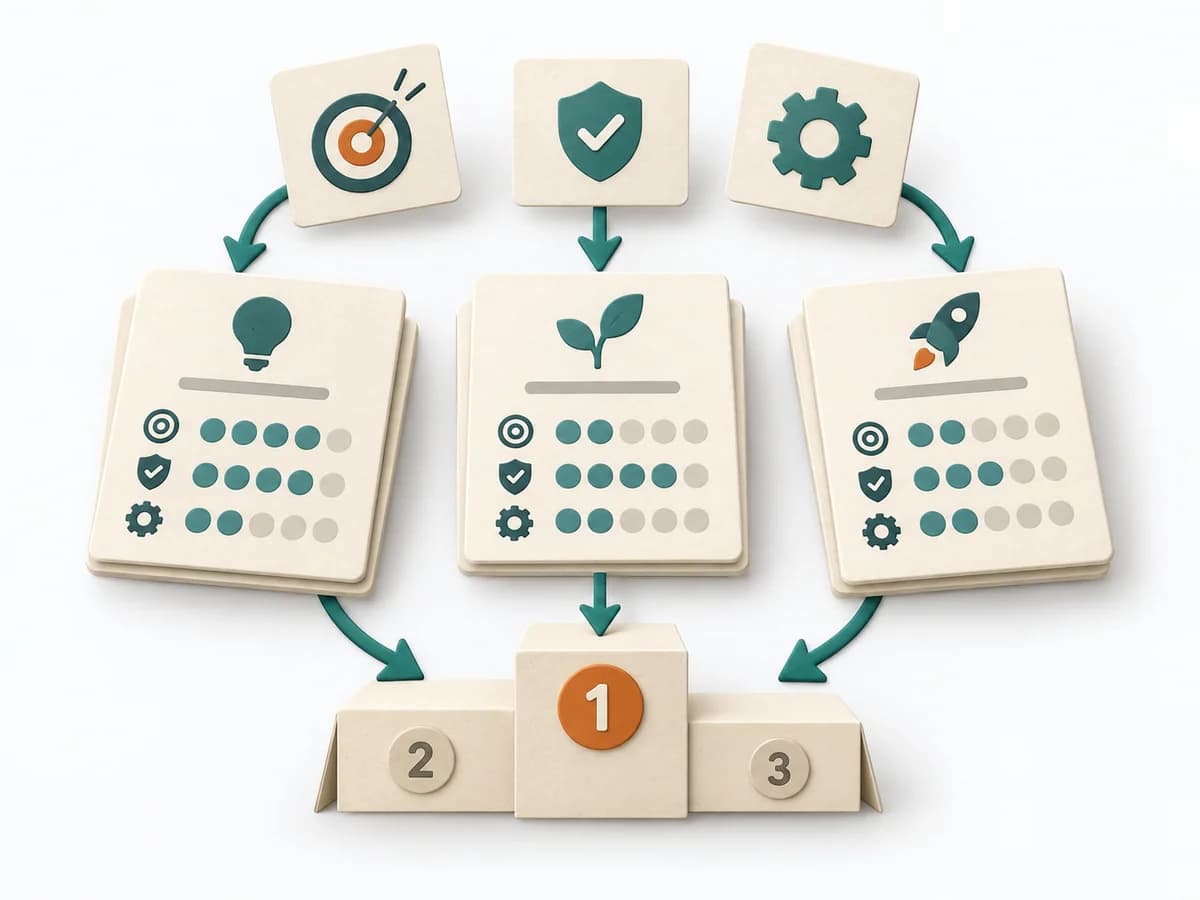 Product Strategy ICE Scoring |
|---|---|---|---|---|
Purposedifferent | When many tasks compete for the same capacity, it orders work by economic impact. It makes time lost, benefit, and effort comparable together. | When a project faces many possible disruptions, it quickly becomes unclear which risks deserve attention first. It separates options, evaluation criteria, and open risks. The result is captured as a Risk Matrix and a Top Risk List. | For decisions with follow-on paths and dependencies, a linear comparison is often not enough. A Decision Tree shows how options branch under conditions and which consequences hang on each branch. | When ideas need sorting quickly, it condenses impact, confidence, and effort into one compact score. It connects customer value, product logic, and decision priorities. The result is captured as an ICE table and top-ideas list. |
Complexitydifferent | High | Low | Medium | Low |
Timedifferent | 45-90 min | 30-60 min | 30-90 min | 30-60 min |
Participantsdifferent | 3-10 | 3-10 | 1-6 | 2-8 |
Formatdifferent | Workshop | Workshop + async | Workshop + async | Workshop + async |
Outputdifferent | Ranked Backlog, Cost-of-Delay Assumptions | Risk Matrix, Top Risk List | Decision Tree, Option Map, Assumption List | ICE Table, Top Idea List |
Tagsno overlap | LeanEconomicsSequencePrioritization | RiskDecisionPrioritizationAssessment | DecisionTreeOptions | PrioritizationScoringGrowthDecision |