View methods side by side.
Choose up to four methods. Add them using the search and share the comparison by copying its link.
| Criterion | 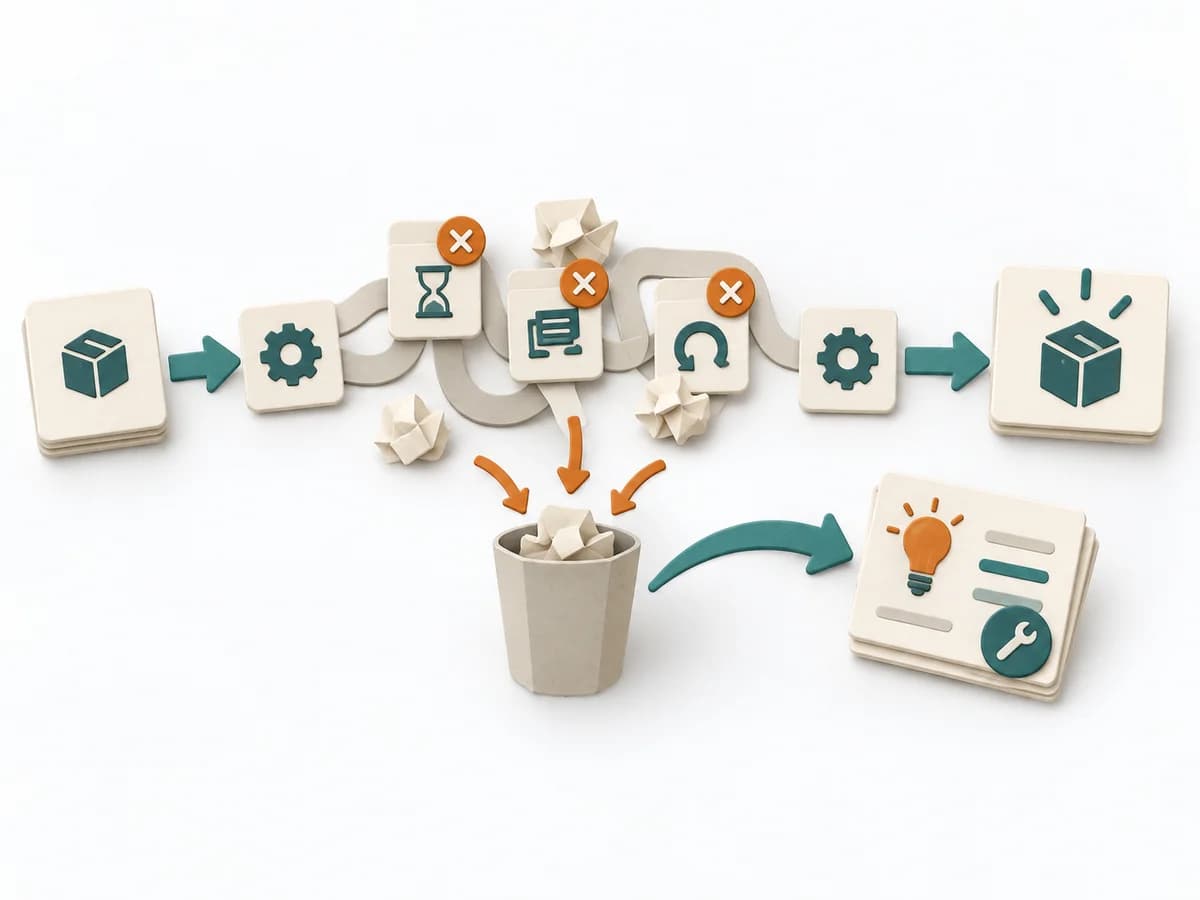 Operations Waste Analysis |  Agile Story Points |  Delivery Value Stream Mapping | 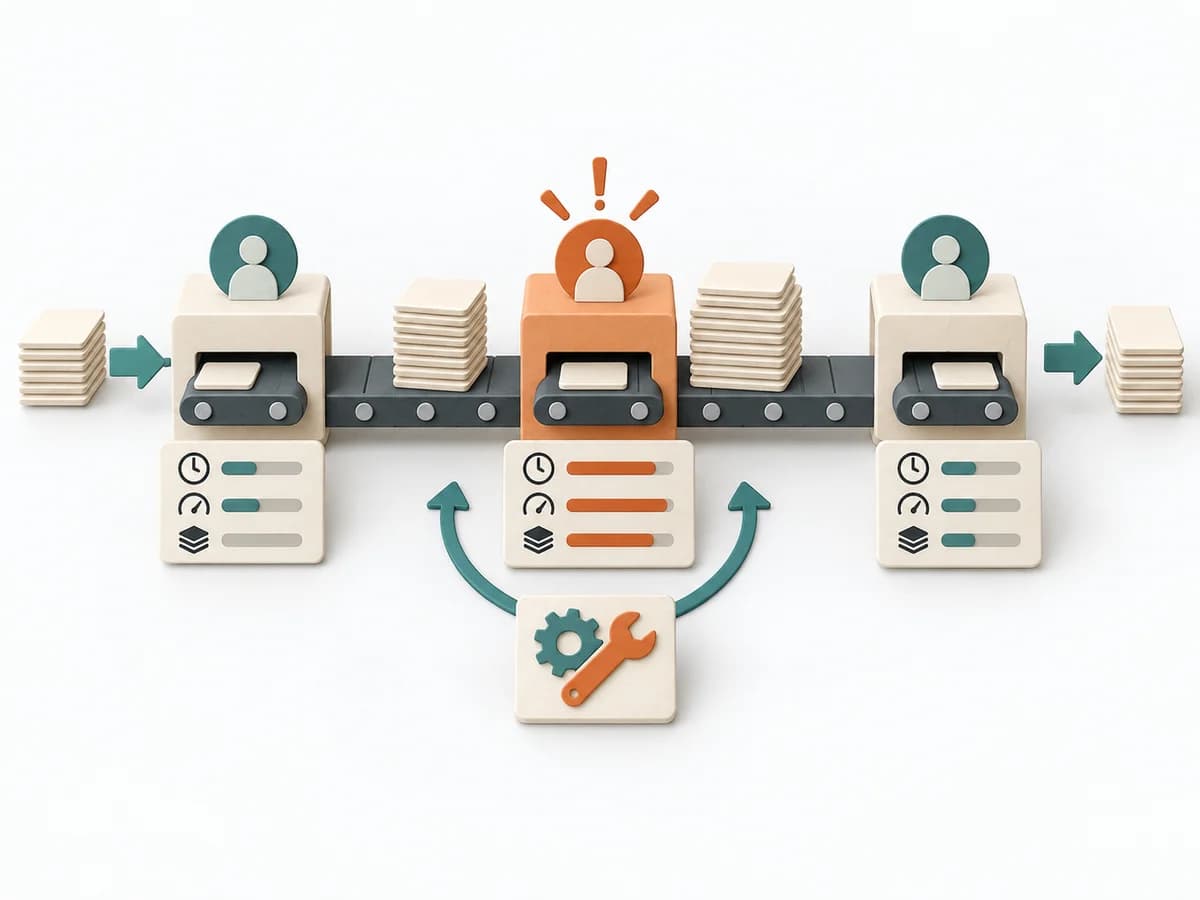 Operations Bottleneck Analysis |
|---|---|---|---|---|
Purposedifferent | For a process that keeps people busy but creates little value, the method exposes waste. It directs attention to unnecessary movement, waiting times, rework, and overdelivery. | When teams want to rate complexity rather than hours, it creates a shared, relative scale. It sorts work by value, risk, and delivery ability. The result is captured as Point Estimates, Reference Stories, and Velocity Data. | When delivery work dissolves into wait times, handoffs, and hidden effort, Value Stream Mapping makes the actual flow visible. The method exposes bottlenecks, idle time, and feedback loops so lead time and improvement levers become tangible. | For a flow that backs up at one point, the method looks for the capacity limit with the greatest leverage. It explains why extra effort elsewhere barely improves throughput. |
Complexitydifferent | Low | Medium | Medium | Medium |
Timedifferent | 45-120 min | laufend, 1-5 min je Item | 1-3 h | 1-3 h |
Participantsdifferent | 2-8 | 3-9 | 4-10 | 3-8 |
Formatdifferent | Workshop | Workshop + async | Workshop | Workshop + async |
Outputdifferent | Waste Map, Prioritized Waste, Improvement Backlog | Point Estimates, Reference Stories, Velocity Data | Current-state map, Future-state map, Bottleneck list | Bottleneck Map, Flow Metrics, Improvement Options, Follow-up Measures |
Tagsno overlap | WasteLeanProcess improvement | EstimationAgileMeasurement | LeanFlowWasteDelivery | FlowMeasurementConstraints |