View methods side by side.
Choose up to four methods. Add them using the search and share the comparison by copying its link.
| Criterion |  Business Strategy VMGS | 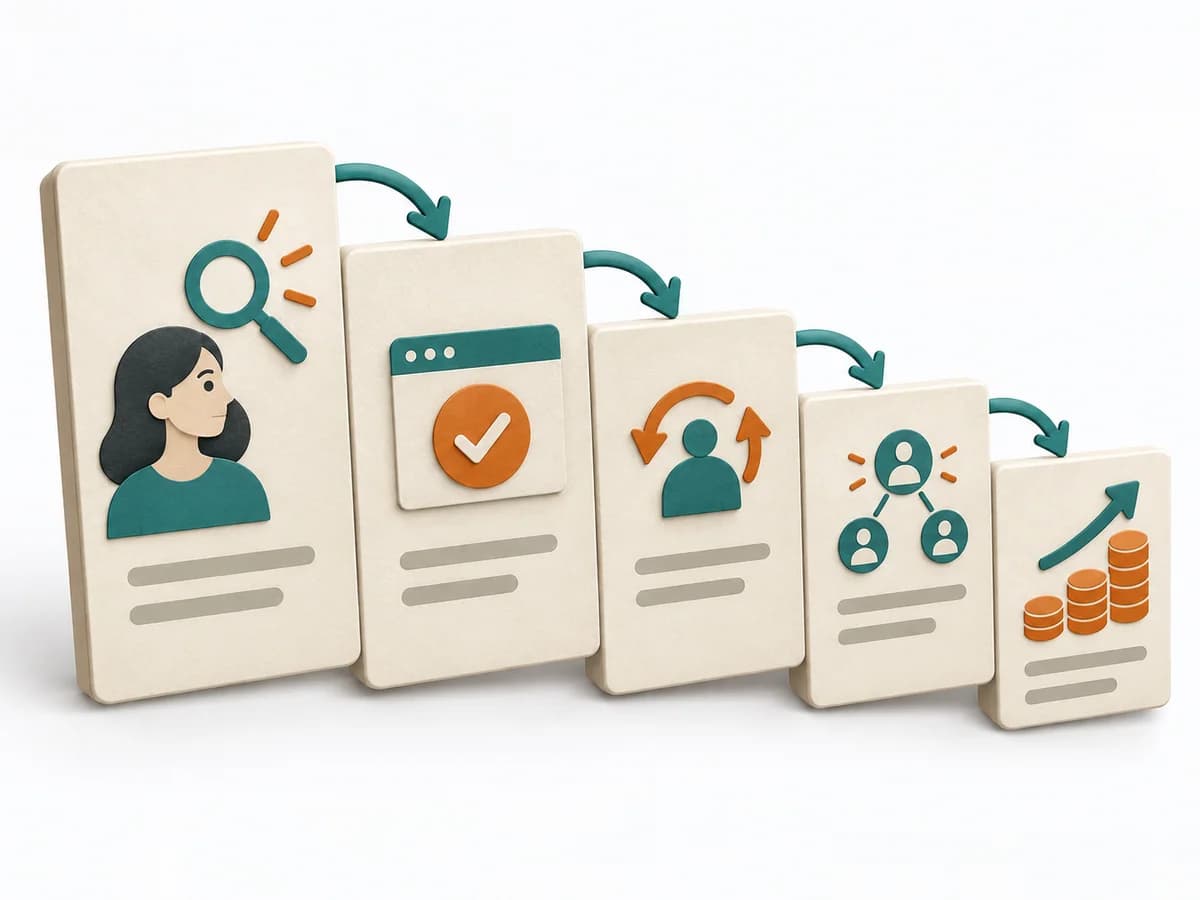 Growth Pirate Metrics AARRR |  Product Strategy Product Vision Board |
|---|---|---|---|
Purposedifferent | VMGS arranges vision, mission, goals, and strategies into a clear guiding logic. Direction, purpose, and priorities are connected so teams can decide more coherently. | For products with complex usage paths, overall growth alone is too coarse to reveal bottlenecks. Pirate Metrics breaks the relationship with the product into consecutive stages and shows where the funnel actually leaks. | When a product needs a shared direction, it connects target audience, benefit, and business picture in a clear vision. It makes the envisioned future legible for the team. |
Complexitydifferent | Medium | Medium | Low |
Timedifferent | 2-4 h | 1-2 h Setup, laufend | 1-2 h |
Participantsdifferent | 3-12 | 2-8 | 2-8 |
Formatdifferent | Workshop | Workshop + async | Workshop + async |
Outputdifferent | Vision Statement, Mission Statement, Goals, Strategies | AARRR funnel, Metric baseline, Experiment backlog | Product Vision Board, Vision Statement, Assumptions and Validation Questions |
Tagsno overlap | VisionGoalsStrategy | GrowthMetricsExperiments | VisionCanvasStrategyAlignment |
Often compared together
Methods with strong topical overlap with the current selection, not yet in the comparison.