View methods side by side.
Choose up to four methods. Add them using the search and share the comparison by copying its link.
| Criterion |  Operations Visual Management | 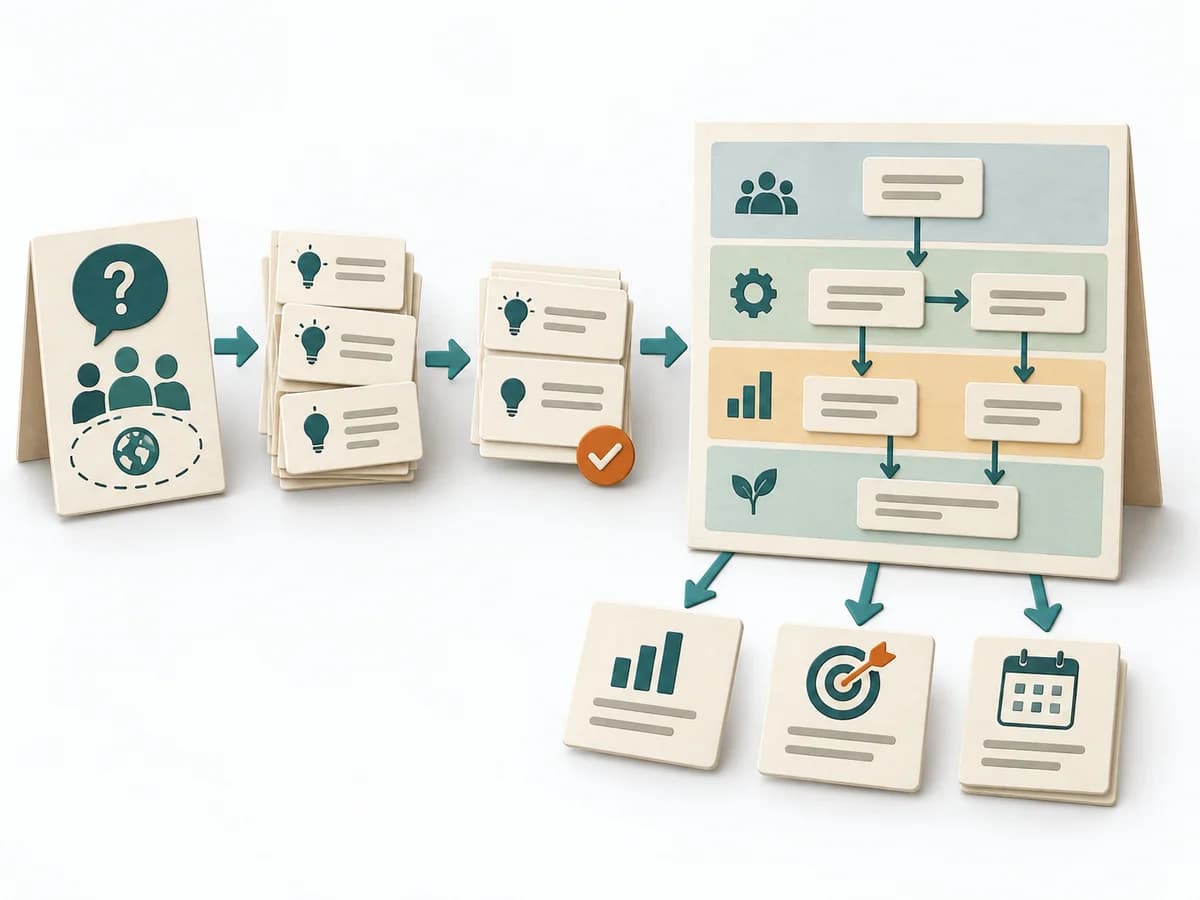 Business Strategy Strategy Map |  Operations Process Mapping | 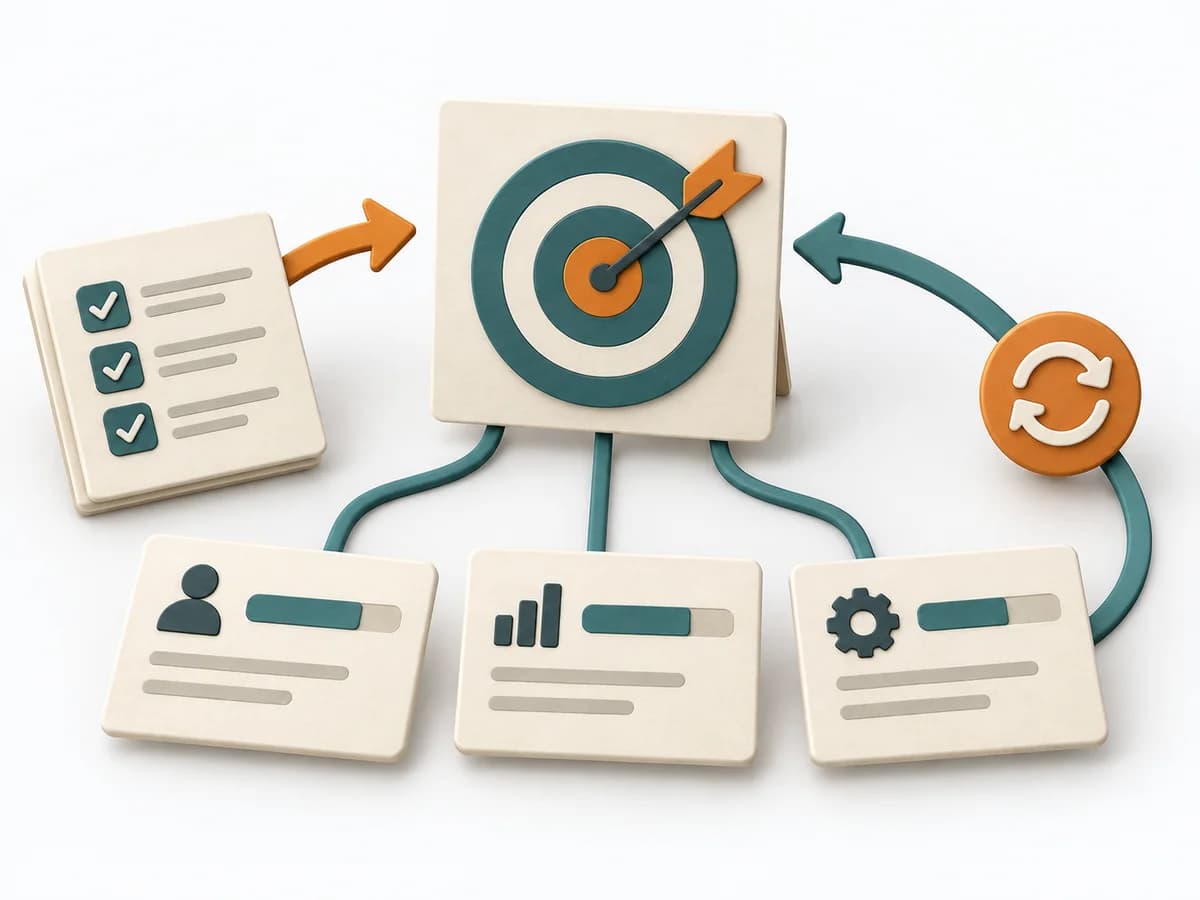 Product Strategy OKRs |
|---|---|---|---|---|
Purposedifferent | With high tempo and many parallel topics, the method makes status, deviations, and priorities visible at a glance. It reduces search effort and prevents what matters from getting lost in daily work. | A Strategy Map translates strategy into a few connected objectives across perspectives such as finance, customers, processes, and learning. This makes visible which capabilities and activities are meant to drive which results. | With a confusing workflow that has many handoffs, the method makes the actual process visible. It shows where work is passed on, delayed, or duplicated, so improvement targets the right spots. | When strategic direction needs to become measurable, it connects ambition with checkable results. It makes goals connectable to focus and review. |
Complexitydifferent | Low | Medium | Medium | Medium |
Timedifferent | Ongoing | 2-4 h workshop plus review | 1-3 h | 1-2 h Setup |
Participantsdifferent | 1-20 | 4-10 | 3-10 | 2-20 |
Formatdifferent | Workshop + async | Workshop | Workshop | Workshop + async |
Outputdifferent | Visual Board, Status Indicators, Exception Cues | Strategy Map, Objective Set, Cause-Effect Hypotheses | Process Map, Handoff List, Improvement Backlog | OKR set, Measurement plan, Review cadence |
Tagsno overlap | SignalsOperationsVisual management | AlignmentExecutionGoalsCausality | ProcessOperationsImprovement | GoalsAlignmentOutcomesMeasurement |