View methods side by side.
Choose up to four methods. Add them using the search and share the comparison by copying its link.
| Criterion |  Operations Visual Management |  Operations Process Mapping | 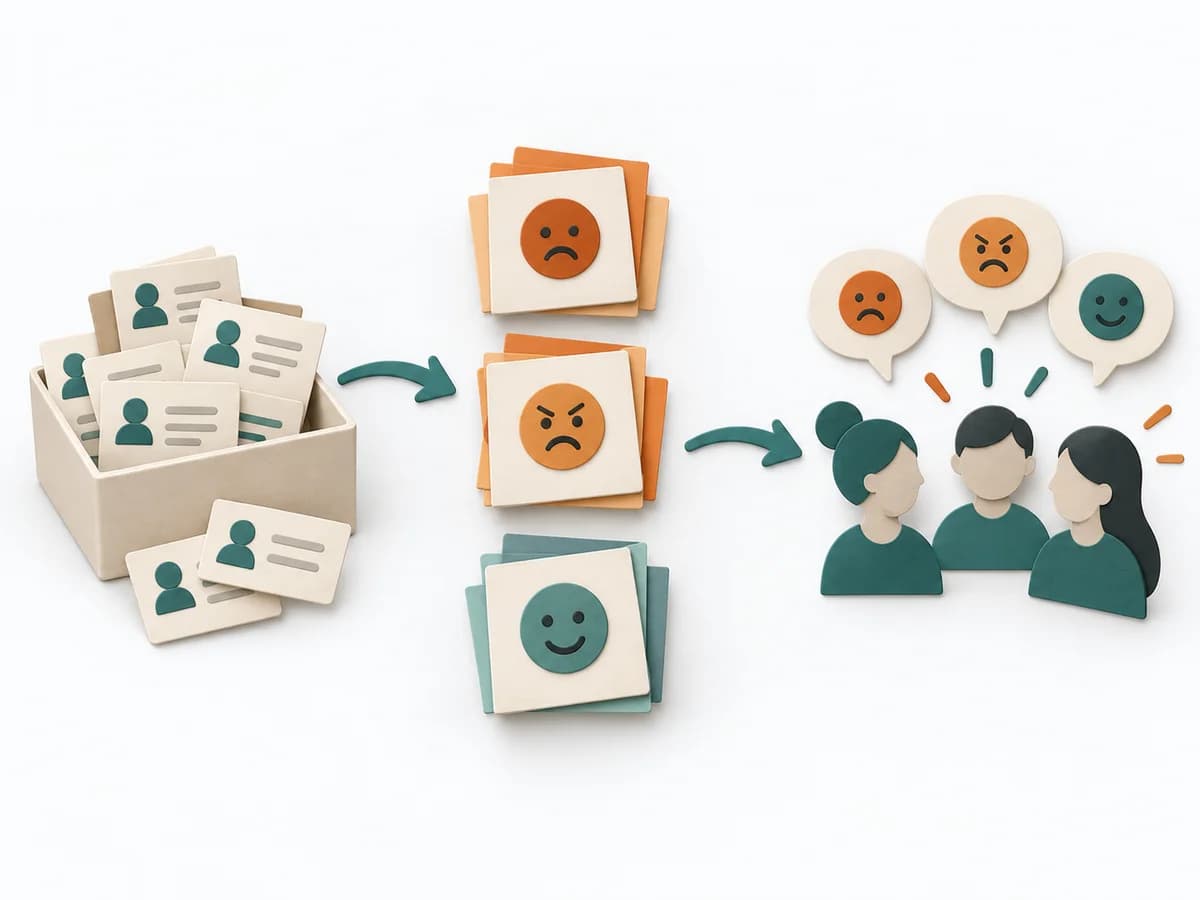 Agile Mad Sad Glad | 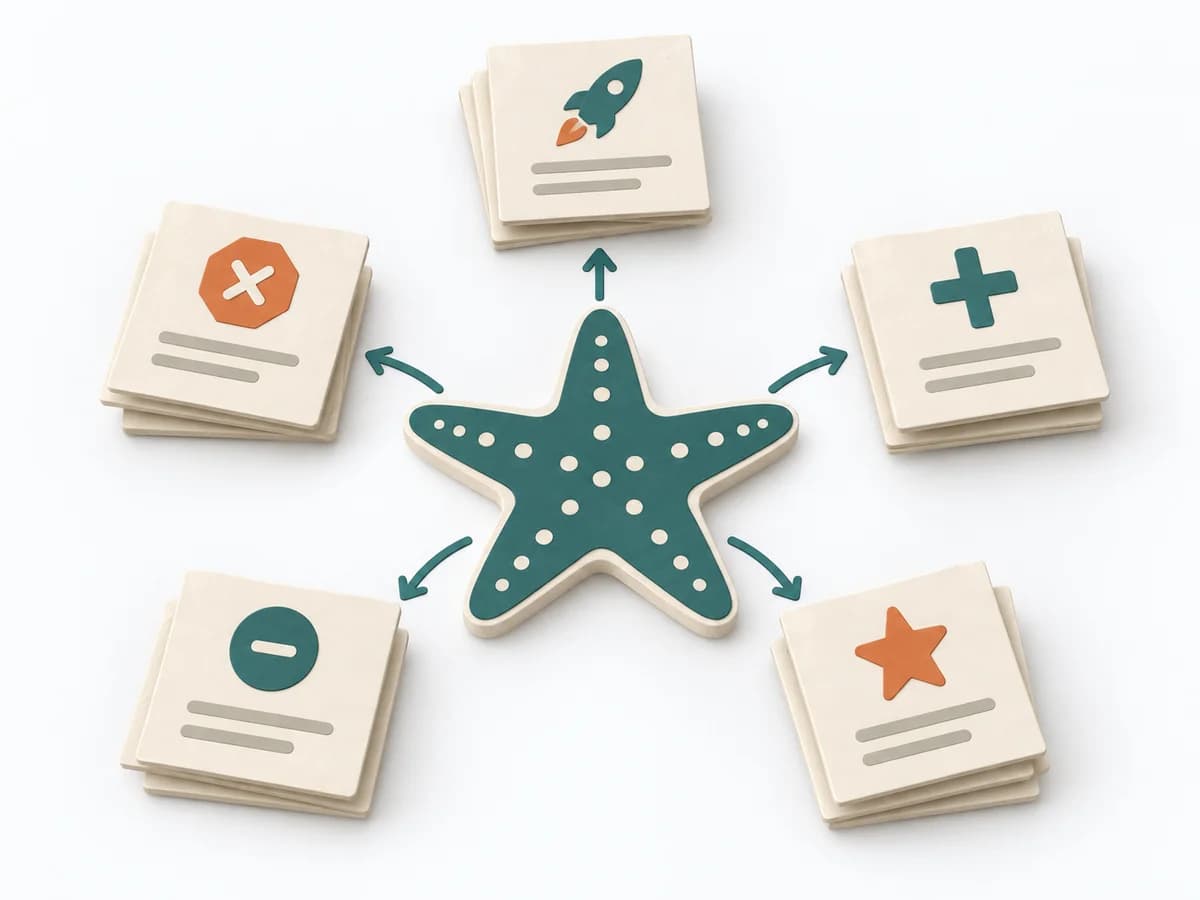 Agile Starfish Retrospective |
|---|---|---|---|---|
Purposedifferent | With high tempo and many parallel topics, the method makes status, deviations, and priorities visible at a glance. It reduces search effort and prevents what matters from getting lost in daily work. | With a confusing workflow that has many handoffs, the method makes the actual process visible. It shows where work is passed on, delayed, or duplicated, so improvement targets the right spots. | When a team's or workshop's mood needs to become readable, it structures emotional signals with little setup. It makes strain, relief, and sources of energy tangible. | When improvement options need to be sorted more finely than just start and stop, it brings observations into clear kinds of action. This makes visible what should be done more, less, newly, or continued. |
Complexitydifferent | Low | Medium | Low | Low |
Timedifferent | Ongoing | 1-3 h | 30-60 min | 45-90 min |
Participantsdifferent | 1-20 | 3-10 | 3-10 | 4-12 |
Formatdifferent | Workshop + async | Workshop | Workshop | Workshop |
Outputdifferent | Visual Board, Status Indicators, Exception Cues | Process Map, Handoff List, Improvement Backlog | Emotion Board, Themes, Action Items | Starfish Board, Practice Changes, Experiments |
Tagsno overlap | SignalsOperationsVisual management | ProcessOperationsImprovement | RetrospectiveTeamReflection | RetrospectiveImprovementExperimentsTeam |