View methods side by side.
Choose up to four methods. Add them using the search and share the comparison by copying its link.
| Criterion |  Operations Visual Management | 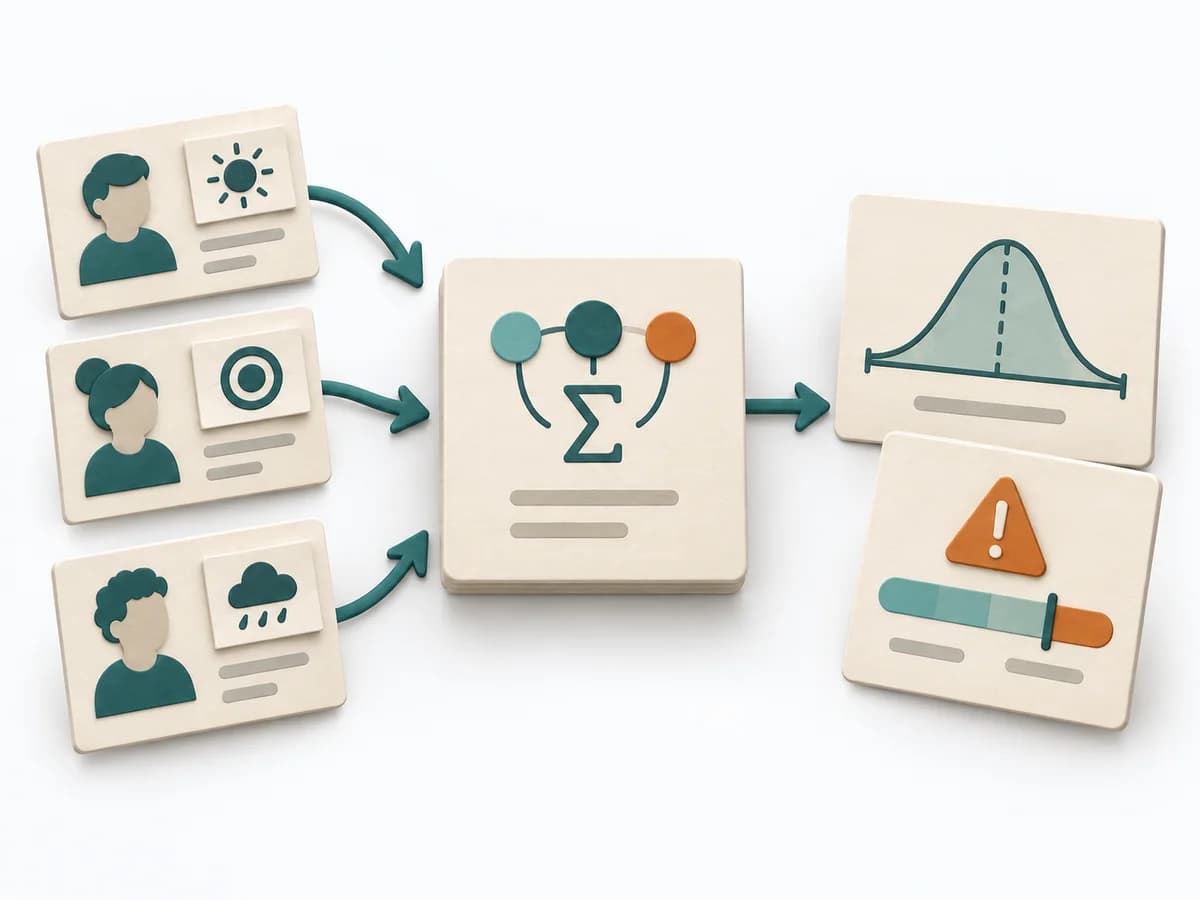 Decision Making PERT Estimation | 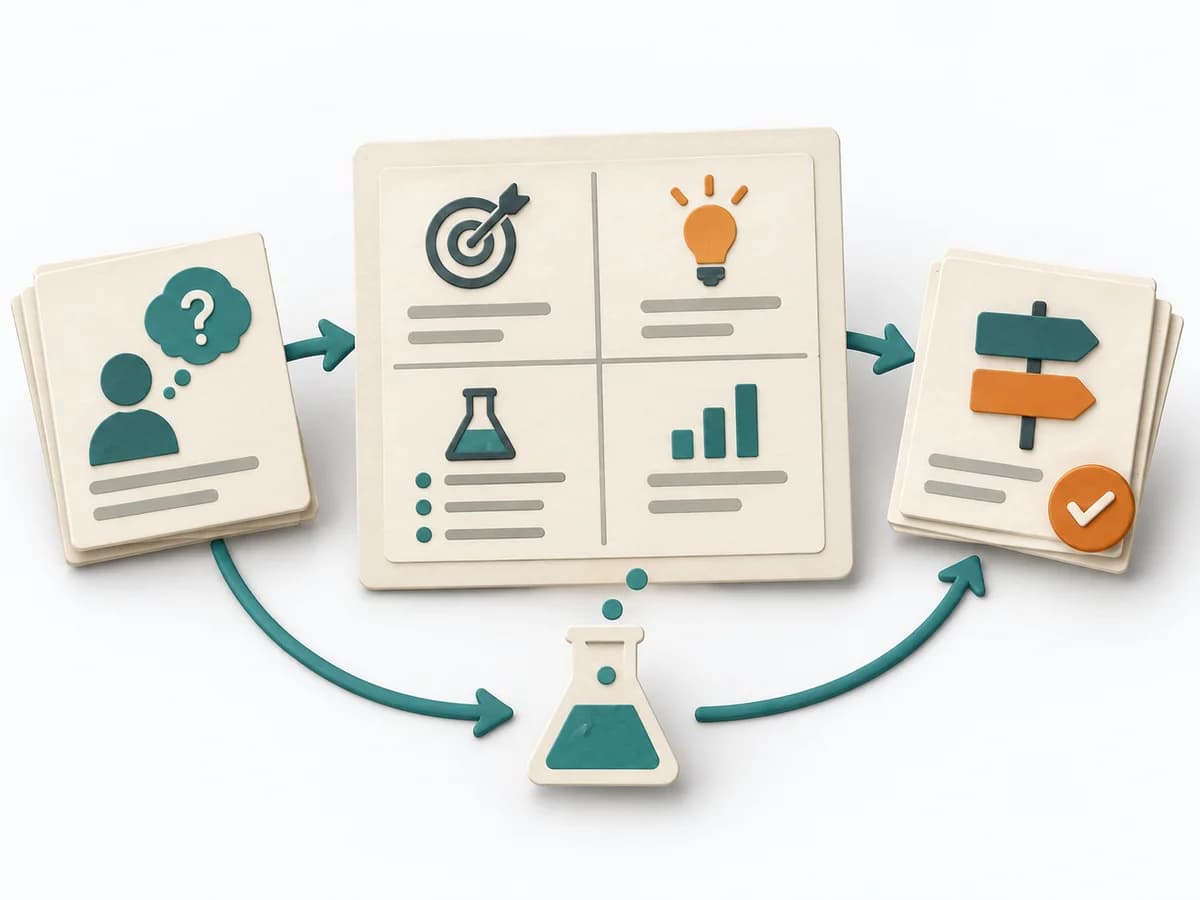 Product Discovery Experiment Canvas |  Product Discovery Test Card |
|---|---|---|---|---|
Purposedifferent | With high tempo and many parallel topics, the method makes status, deviations, and priorities visible at a glance. It reduces search effort and prevents what matters from getting lost in daily work. | On complex initiatives, a plain average tends to understate just how uncertain the outcome really is. It separates options, evaluation criteria, and open risks. The result is captured as a PERT Estimate, Expected Value, and Risk Notes. | When experiments become unreadable after the fact, it arranges hypothesis, signal, and learning goal on a single canvas. It separates problem, assumption, solution, and evidence. The result is captured as a Completed Experiment Canvas and a Success Metric. | The Test Card turns a critical assumption into a testable claim and specifies in advance which result counts as success. |
Complexitydifferent | Low | Medium | Low | Low |
Timedifferent | Ongoing | 15-45 min | 30-60 min | 20-35 min |
Participantsdifferent | 1-20 | 1-8 | 1-5 | 1-5 |
Formatsame | Workshop + async | Workshop + async | Workshop + async | Workshop + async |
Outputdifferent | Visual Board, Status Indicators, Exception Cues | PERT Estimate, Expected Value, Risk Notes | Completed Experiment Canvas, Success Metric | Test Card with a pre-set threshold |
Tagsno overlap | SignalsOperationsVisual management | EstimationUncertaintyRisk | ExperimentsValidationDiscoveryHypothesis | ExperimentsValidationDiscoveryHypothesis |