View methods side by side.
Choose up to four methods. Add them using the search and share the comparison by copying its link.
| Criterion |  Operations Visual Management | 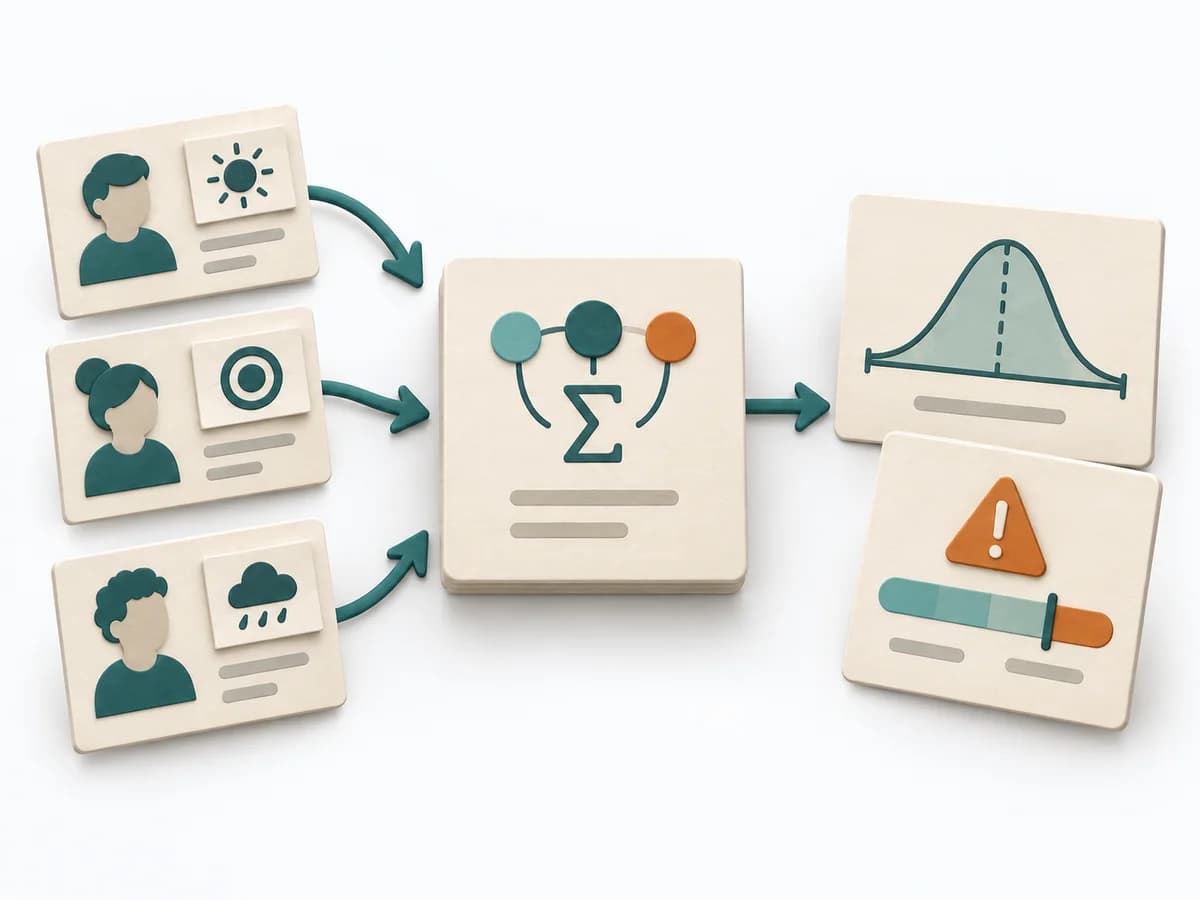 Decision Making PERT Estimation |  Operations After-Action Review |  Operations Failure Mode and Effects Analysis |
|---|---|---|---|---|
Purposedifferent | With high tempo and many parallel topics, the method makes status, deviations, and priorities visible at a glance. It reduces search effort and prevents what matters from getting lost in daily work. | On complex initiatives, a plain average tends to understate just how uncertain the outcome really is. It separates options, evaluation criteria, and open risks. The result is captured as a PERT Estimate, Expected Value, and Risk Notes. | After missions or project phases with unclear outcomes, the method makes visible what actually happened and what can be learned from it. It separates course, effect, and causes so experience turns into solid improvement. | For a process, product, or service with noticeable failure risks, the method assesses possible failure modes in advance. It directs attention to combinations of occurrence, effect, and detectability. |
Complexitydifferent | Low | Medium | Low | High |
Timedifferent | Ongoing | 15-45 min | 20-45 min | 2-6 h |
Participantsdifferent | 1-20 | 1-8 | 3-12 | 3-10 |
Formatdifferent | Workshop + async | Workshop + async | Workshop + async | Workshop |
Outputdifferent | Visual Board, Status Indicators, Exception Cues | PERT Estimate, Expected Value, Risk Notes | Lessons learned, Action items, Event summary | FMEA Table, Risk Priority, Mitigation Actions |
Tagsno overlap | SignalsOperationsVisual management | EstimationUncertaintyRisk | LearningOperationsImprovement | RiskQualityOperationsRoot cause |