View methods side by side.
Choose up to four methods. Add them using the search and share the comparison by copying its link.
| Criterion |  Operations Visual Management |  Delivery MoSCoW | 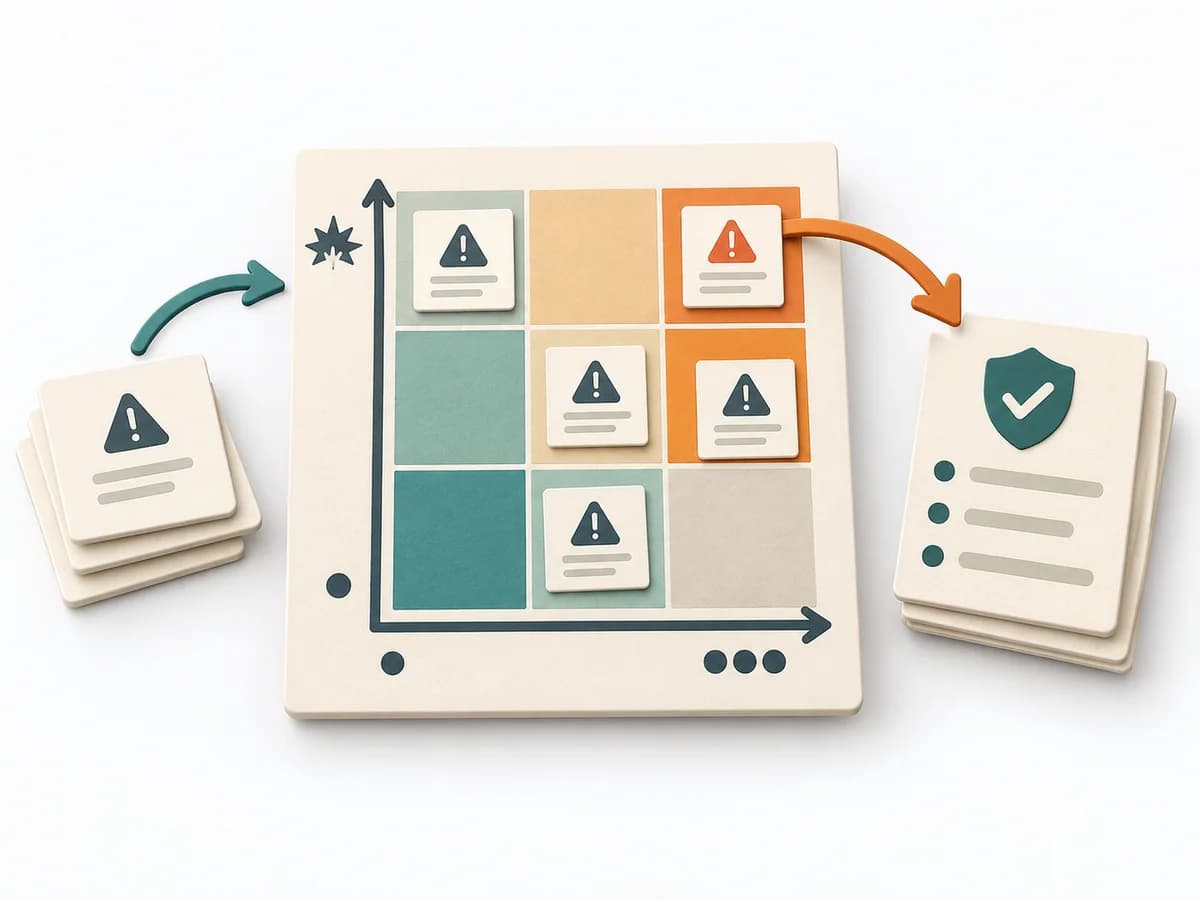 Decision Making Risk Matrix |  Operations Failure Mode and Effects Analysis |
|---|---|---|---|---|
Purposedifferent | With high tempo and many parallel topics, the method makes status, deviations, and priorities visible at a glance. It reduces search effort and prevents what matters from getting lost in daily work. | When a release carries too many demands and priorities are only ever negotiated, MoSCoW creates clear boundaries for the next cut. Must, Should, Could, and Won't make commitment, room for maneuver, and trade-off logic visible to everyone involved. | When a project faces many possible disruptions, it quickly becomes unclear which risks deserve attention first. It separates options, evaluation criteria, and open risks. The result is captured as a Risk Matrix and a Top Risk List. | For a process, product, or service with noticeable failure risks, the method assesses possible failure modes in advance. It directs attention to combinations of occurrence, effect, and detectability. |
Complexitydifferent | Low | Low | Low | High |
Timedifferent | Ongoing | 30-90 min | 30-60 min | 2-6 h |
Participantsdifferent | 1-20 | 3-12 | 3-10 | 3-10 |
Formatdifferent | Workshop + async | Workshop + async | Workshop + async | Workshop |
Outputdifferent | Visual Board, Status Indicators, Exception Cues | Prioritized Backlog, Release Scope, Tradeoff Notes | Risk Matrix, Top Risk List | FMEA Table, Risk Priority, Mitigation Actions |
Tagsno overlap | SignalsOperationsVisual management | PrioritizationScopeDecision | RiskDecisionPrioritizationAssessment | RiskQualityOperationsRoot cause |