View methods side by side.
Choose up to four methods. Add them using the search and share the comparison by copying its link.
| Criterion |  Operations Visual Management | 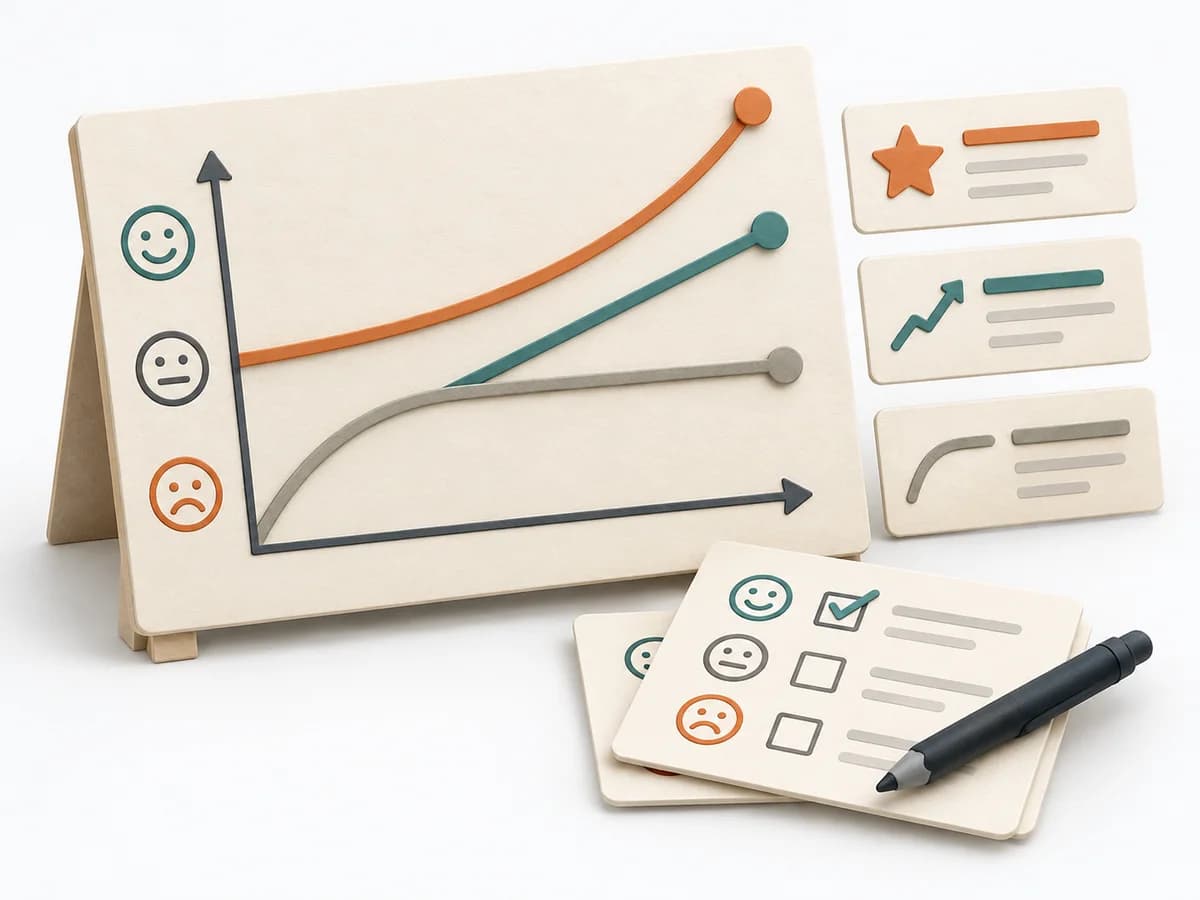 Product Discovery Kano Model | 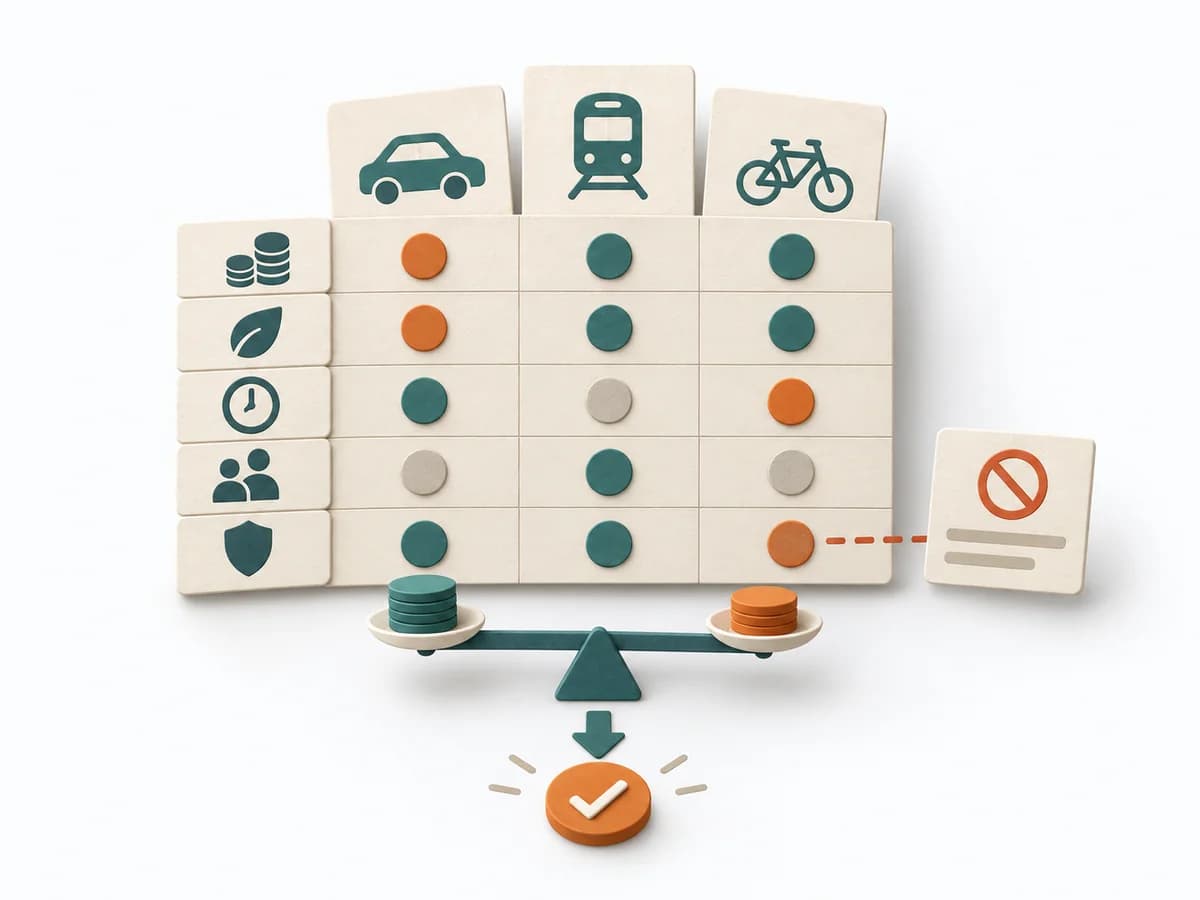 Decision Making Trade-off Analysis |  Delivery Cost of Delay |
|---|---|---|---|---|
Purposedifferent | With high tempo and many parallel topics, the method makes status, deviations, and priorities visible at a glance. It reduces search effort and prevents what matters from getting lost in daily work. | When features need to be distinguished by their effect on satisfaction, it makes expectations and surprises comparable. It separates basic needs, performance contribution, and delight. | With limited resources, quality, speed, cost, and risk almost always compete with each other. Trade-off Analysis makes these tensions explicit and prevents decisions from producing hidden side effects. | Helps clarify scope, order, and delivery flow in concrete terms. It makes work, constraints, and sequence manageable. The result is captured as a Cost of Delay table and prioritization sequence. |
Complexitydifferent | Low | Medium | Medium | High |
Timedifferent | Ongoing | 1-2 Tage | 45-120 min | 90-180 min |
Participantsdifferent | 1-20 | 10-50 | 2-8 | 3-8 |
Formatdifferent | Workshop + async | Workshop + async | Workshop + async | Workshop |
Outputdifferent | Visual Board, Status Indicators, Exception Cues | Kano Matrix, Feature Classes, Priority Themes | Trade-off Matrix, Criteria List, Decision Rationale, Accepted Downsides | CoD Table, Prioritization Sequence |
Tagsno overlap | SignalsOperationsVisual management | SatisfactionPrioritizationCustomer | TradeoffsDecisionCriteriaOptions | PrioritizationDeliveryEconomicsDecision |