View methods side by side.
Choose up to four methods. Add them using the search and share the comparison by copying its link.
| Criterion |  Operations Visual Management | 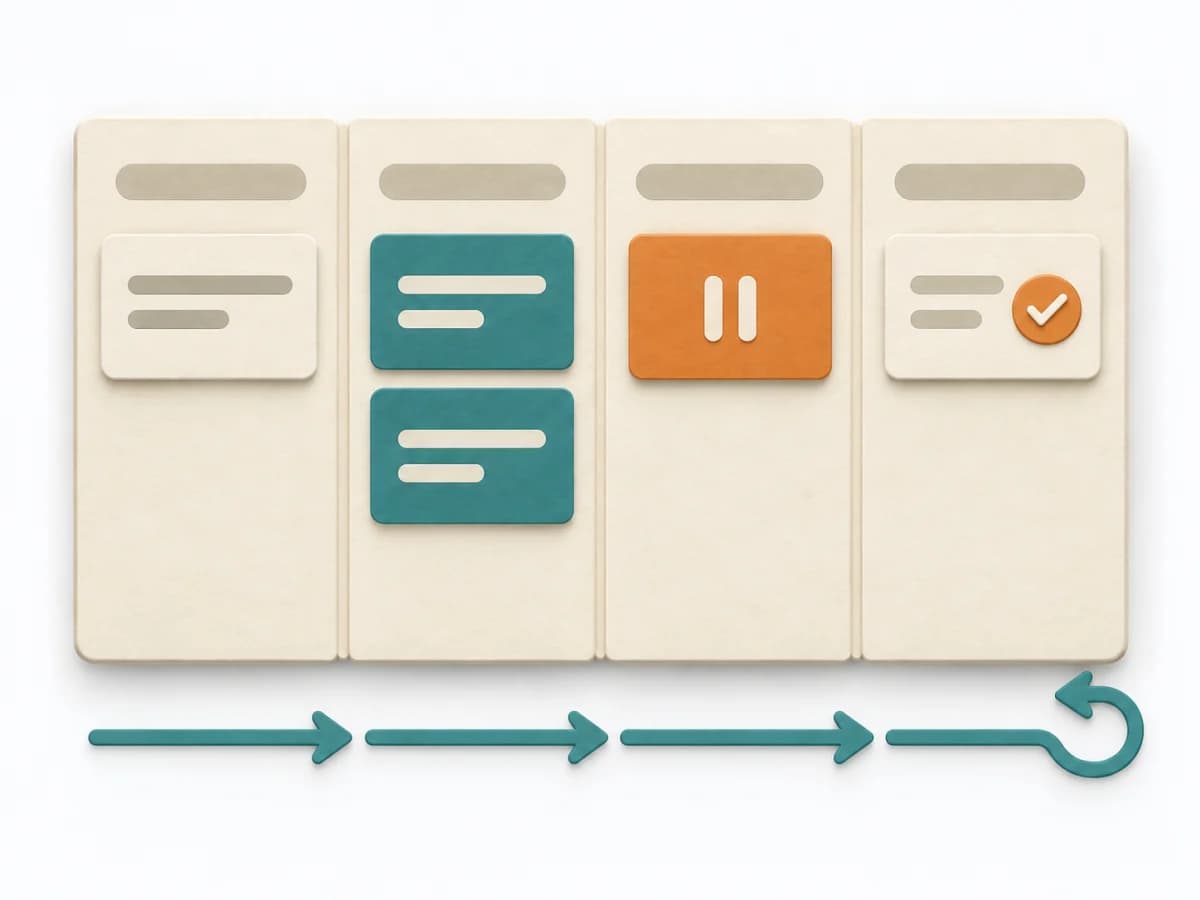 Engineering Kanban |  Delivery Cost of Delay | 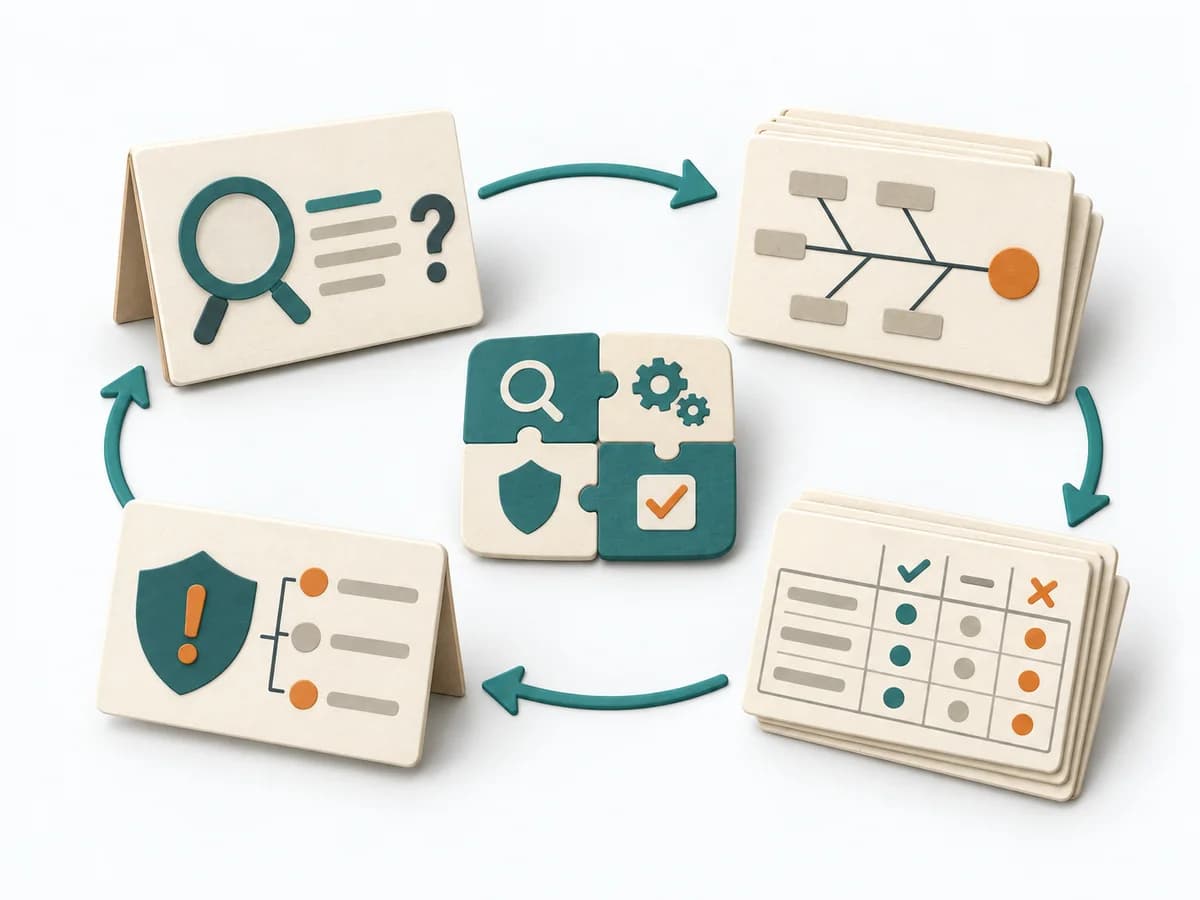 Operations Kepner-Tregoe |
|---|---|---|---|---|
Purposedifferent | With high tempo and many parallel topics, the method makes status, deviations, and priorities visible at a glance. It reduces search effort and prevents what matters from getting lost in daily work. | When work sits in too many parallel streams, throughput suffers and no one sees the bottlenecks. Kanban makes the flow of work visible and limits overload so a system becomes calmer and more predictable. | Helps clarify scope, order, and delivery flow in concrete terms. It makes work, constraints, and sequence manageable. The result is captured as a Cost of Delay table and prioritization sequence. | For a disturbance that's hard to pin down, the method cleanly separates problem, cause, and decision. It reduces mixing when symptoms allow several interpretations. |
Complexitydifferent | Low | Medium | High | High |
Timedifferent | Ongoing | Ongoing | 90-180 min | 2-8 h |
Participantsdifferent | 1-20 | 2-12 | 3-8 | 2-8 |
Formatdifferent | Workshop + async | Workshop + async | Workshop | Workshop + async |
Outputdifferent | Visual Board, Status Indicators, Exception Cues | Kanban board, WIP policies, Flow metrics | CoD Table, Prioritization Sequence | Problem Analysis, Decision Analysis, Risk Plan |
Tagsno overlap | SignalsOperationsVisual management | FlowVisual managementDelivery | PrioritizationDeliveryEconomicsDecision | Problem solvingRoot causeDecisionOperations |