View methods side by side.
Choose up to four methods. Add them using the search and share the comparison by copying its link.
| Criterion |  Operations Visual Management | 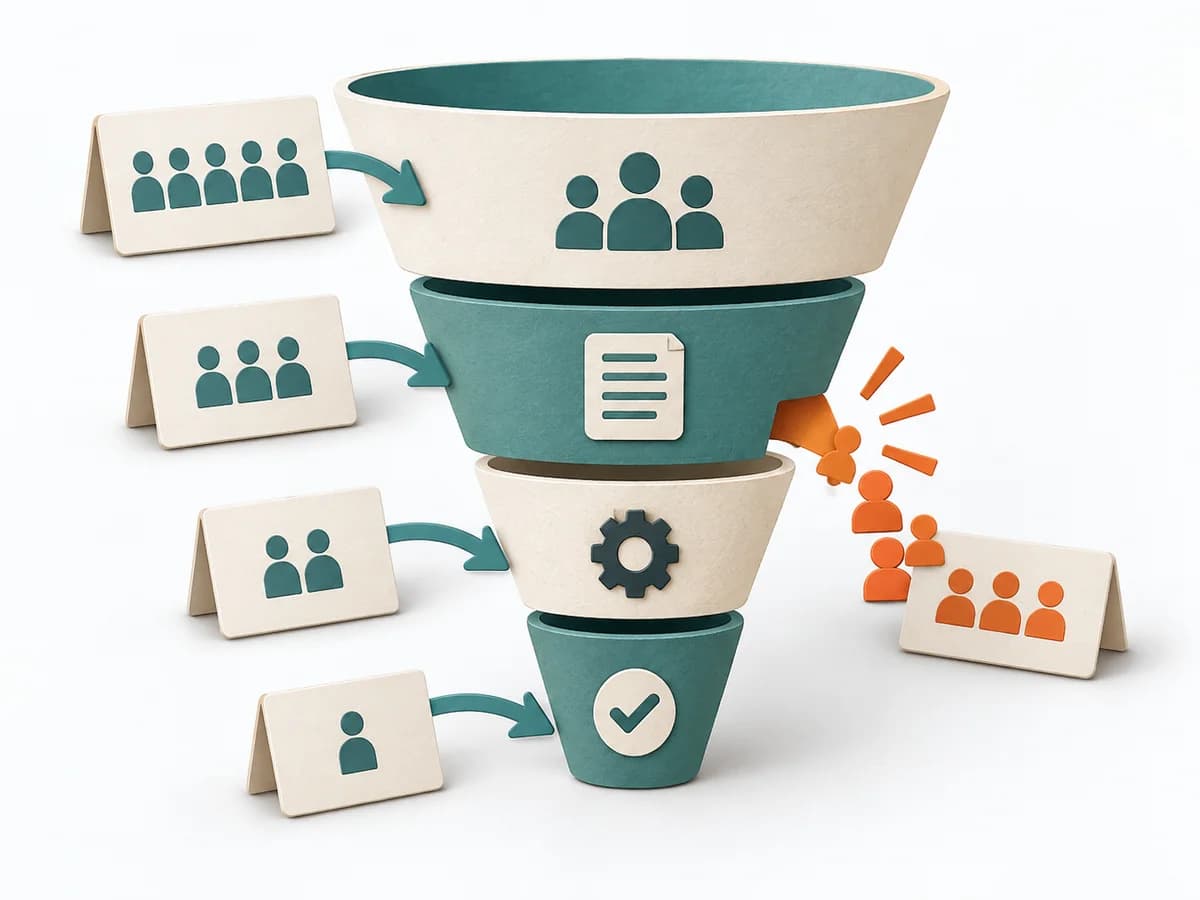 Growth Funnel Analysis |  Operations Root Cause Analysis |  Operations Failure Mode and Effects Analysis |
|---|---|---|---|---|
Purposedifferent | With high tempo and many parallel topics, the method makes status, deviations, and priorities visible at a glance. It reduces search effort and prevents what matters from getting lost in daily work. | When many visitors or users drop off along the way, the reason behind the number often stays hidden. Funnel Analysis exposes these transitions and makes visible exactly where the path collapses. | When a problem keeps recurring and the cause stays unclear, the method exposes the underlying mechanism. It separates symptom, guess, and robust explanation from one another. | For a process, product, or service with noticeable failure risks, the method assesses possible failure modes in advance. It directs attention to combinations of occurrence, effect, and detectability. |
Complexitydifferent | Low | Medium | Medium | High |
Timedifferent | Ongoing | 1-3 h | 1-4 h | 2-6 h |
Participantsdifferent | 1-20 | 1-5 | 3-8 | 3-10 |
Formatdifferent | Workshop + async | Async | Workshop + async | Workshop |
Outputdifferent | Visual Board, Status Indicators, Exception Cues | Funnel report, Drop-off analysis, Optimization hypotheses | Problem Statement, Cause Hypotheses, Confirmed Causes, Action Plan | FMEA Table, Risk Priority, Mitigation Actions |
Tagsno overlap | SignalsOperationsVisual management | AnalyticsConversionGrowth | Root causeProblem solvingQualityIncident | RiskQualityOperationsRoot cause |