View methods side by side.
Choose up to four methods. Add them using the search and share the comparison by copying its link.
| Criterion |  Delivery Value Stream Mapping |  Operations Root Cause Analysis | 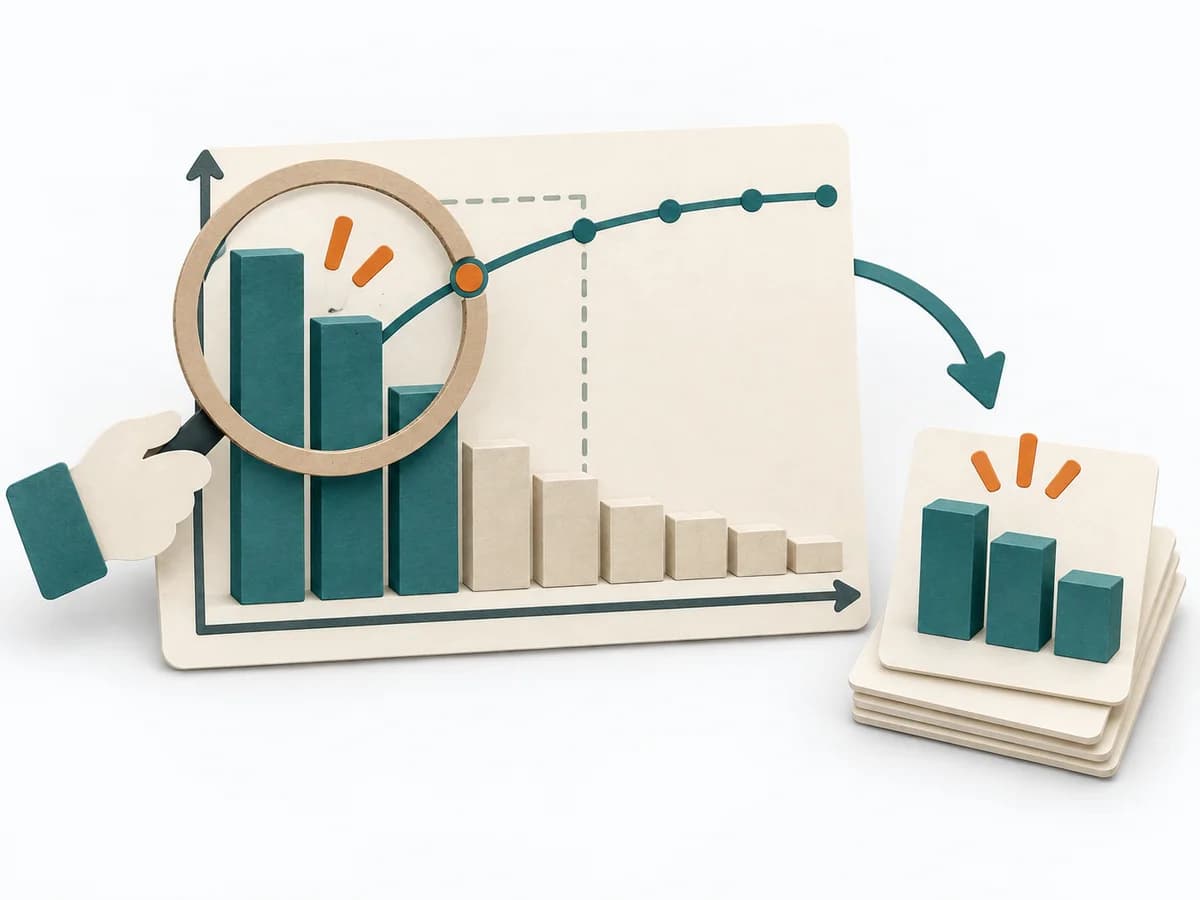 Decision Making Pareto Analysis |  Operations 5 Whys |
|---|---|---|---|---|
Purposedifferent | When delivery work dissolves into wait times, handoffs, and hidden effort, Value Stream Mapping makes the actual flow visible. The method exposes bottlenecks, idle time, and feedback loops so lead time and improvement levers become tangible. | When a problem keeps recurring and the cause stays unclear, the method exposes the underlying mechanism. It separates symptom, guess, and robust explanation from one another. | In many problem situations, effect is distributed unequally across many causes. A Pareto Analysis separates the few drivers with high leverage from the long remainder and focuses attention on what measurably moves the needle. | For a single, hard-to-explain deviation, the method exposes the causal chain behind the visible symptom. It keeps the cause open until a controllable condition emerges instead of a mere description. |
Complexitydifferent | Medium | Medium | Low | Low |
Timedifferent | 1-3 h | 1-4 h | 30-60 min | 15-30 min |
Participantsdifferent | 4-10 | 3-8 | 1-6 | 2-6 |
Formatdifferent | Workshop | Workshop + async | Workshop + async | Workshop |
Outputdifferent | Current-state map, Future-state map, Bottleneck list | Problem Statement, Cause Hypotheses, Confirmed Causes, Action Plan | Pareto Chart, Top Causes, Focus List | Root cause notes, Countermeasures |
Tagsno overlap | LeanFlowWasteDelivery | Root causeProblem solvingQualityIncident | PrioritizationQualityFocusRoot cause | Root causeIncidentLeanProblem solving |