View methods side by side.
Choose up to four methods. Add them using the search and share the comparison by copying its link.
| Criterion | 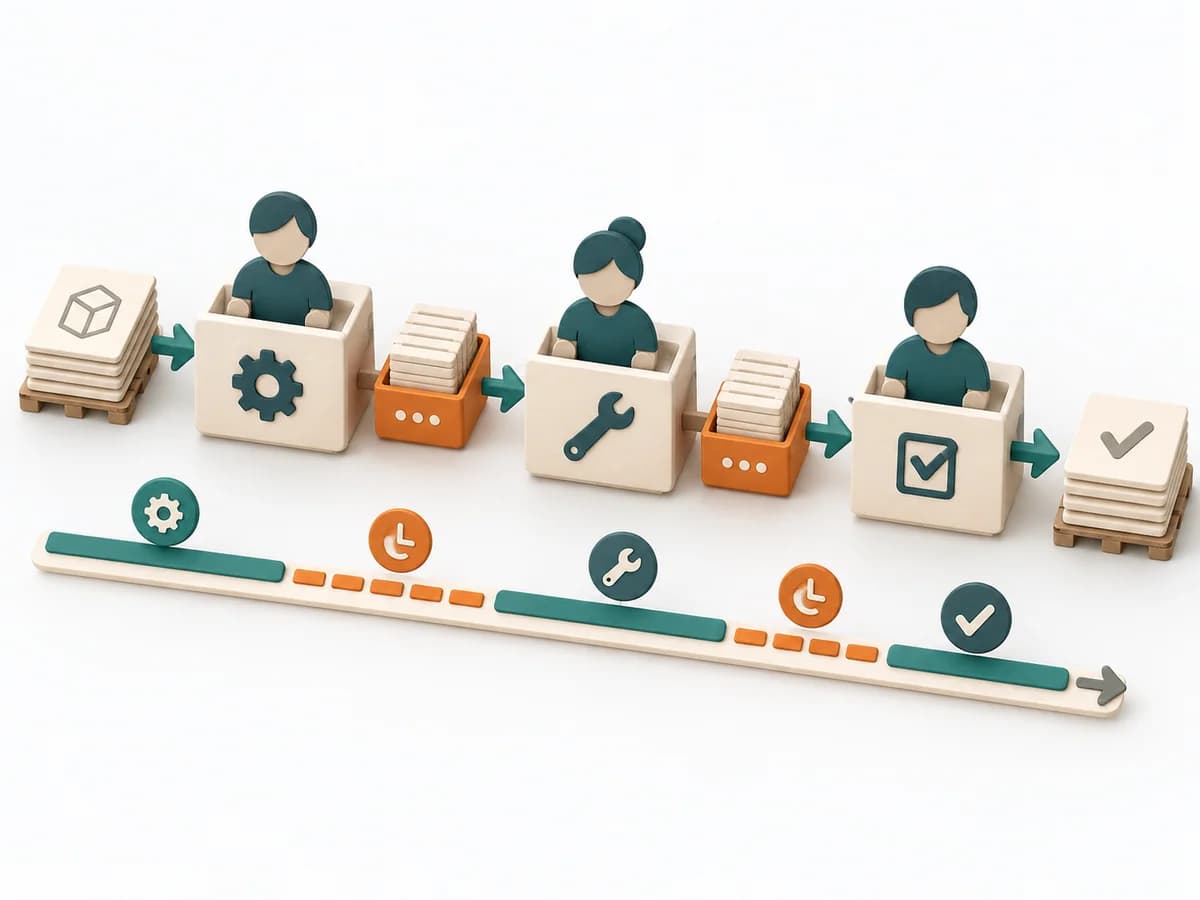 Delivery Value Stream Mapping | 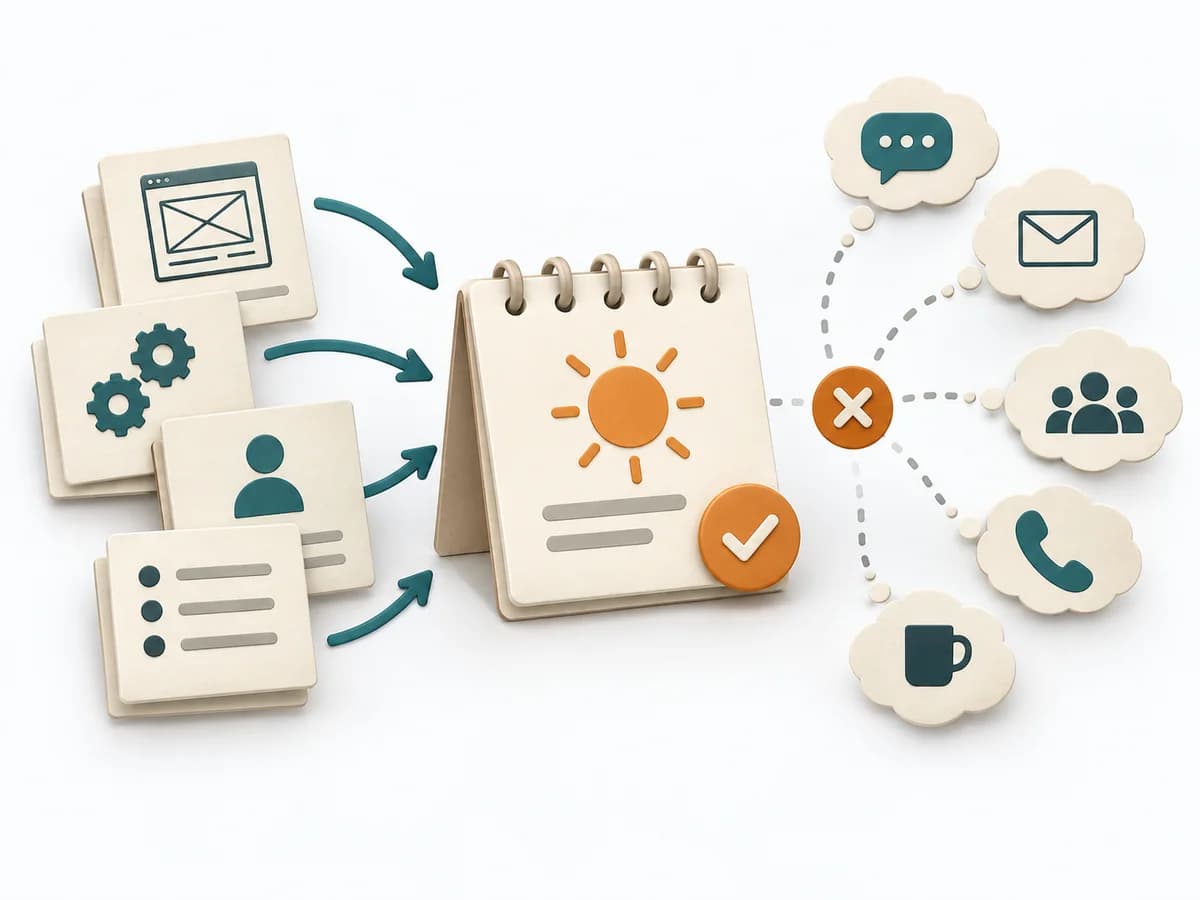 Agile Ideal Days |  Operations Failure Mode and Effects Analysis | 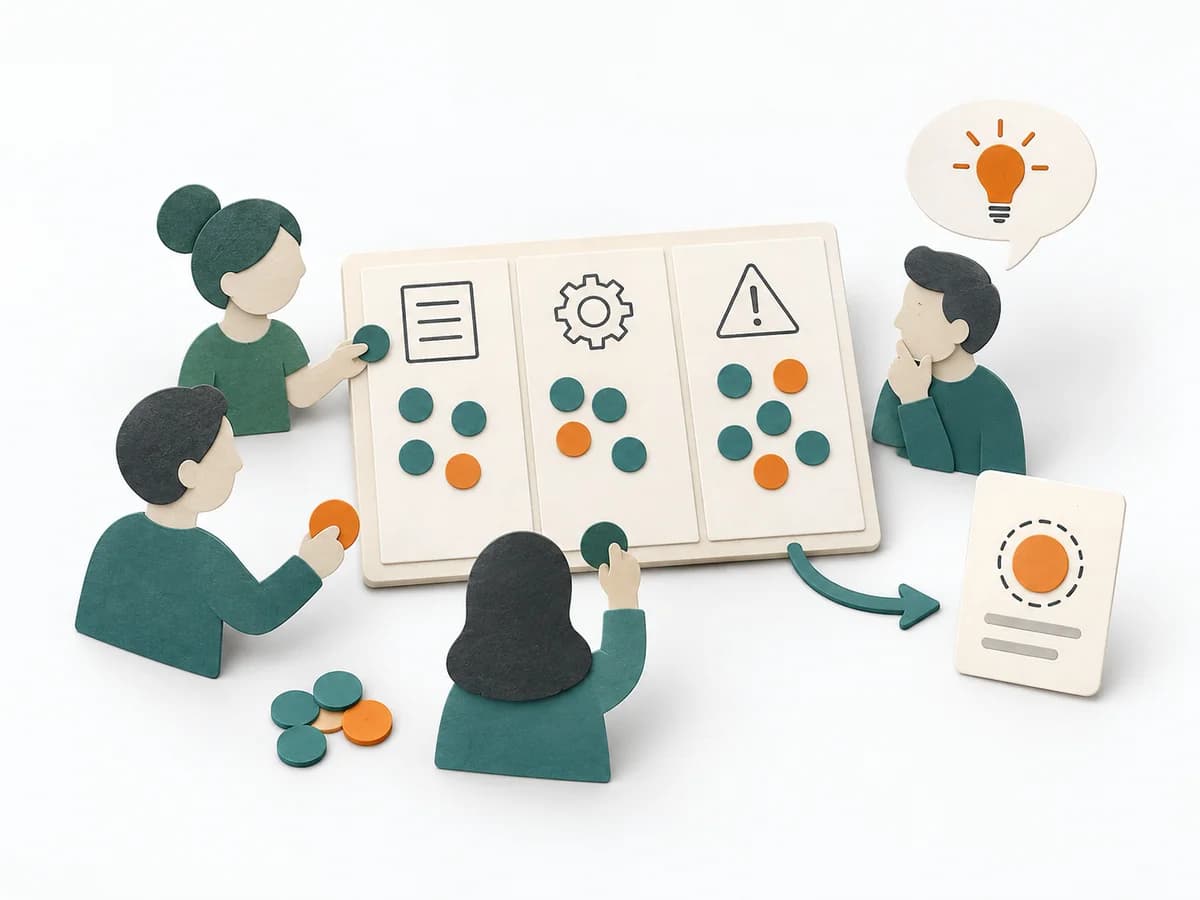 Facilitation Dot Estimation |
|---|---|---|---|---|
Purposedifferent | When delivery work dissolves into wait times, handoffs, and hidden effort, Value Stream Mapping makes the actual flow visible. The method exposes bottlenecks, idle time, and feedback loops so lead time and improvement levers become tangible. | When effort needs to be thought of as real working time, it offers a simple common denominator for comparison. It sorts work by value, risk, and delivery ability. The result is captured as Ideal Day Estimates, Assumption Notes, and Capacity Caveats. | For a process, product, or service with noticeable failure risks, the method assesses possible failure modes in advance. It directs attention to combinations of occurrence, effect, and detectability. | When size or effort can only be estimated roughly, Dot Estimation condenses the group's experience into a quick range. It turns individual contributions into a visible selection. The result is captured as an Effort Heatmap, Risk Signals, and Discussion Targets. |
Complexitydifferent | Medium | Low | High | Low |
Timedifferent | 1-3 h | 15-60 min | 2-6 h | 5-20 min |
Participantsdifferent | 4-10 | 2-9 | 3-10 | 3-20 |
Formatdifferent | Workshop | Workshop + async | Workshop | Workshop |
Outputdifferent | Current-state map, Future-state map, Bottleneck list | Ideal Day Estimates, Assumption Notes, Capacity Caveats | FMEA Table, Risk Priority, Mitigation Actions | Effort Heatmap, Risk Signals, Discussion Targets |
Tagsno overlap | LeanFlowWasteDelivery | EstimationEffortAgile | RiskQualityOperationsRoot cause | EstimationEffortRisk |