View methods side by side.
Choose up to four methods. Add them using the search and share the comparison by copying its link.
| Criterion |  Product Strategy Value Proposition Canvas |  Growth Growth Experiment | 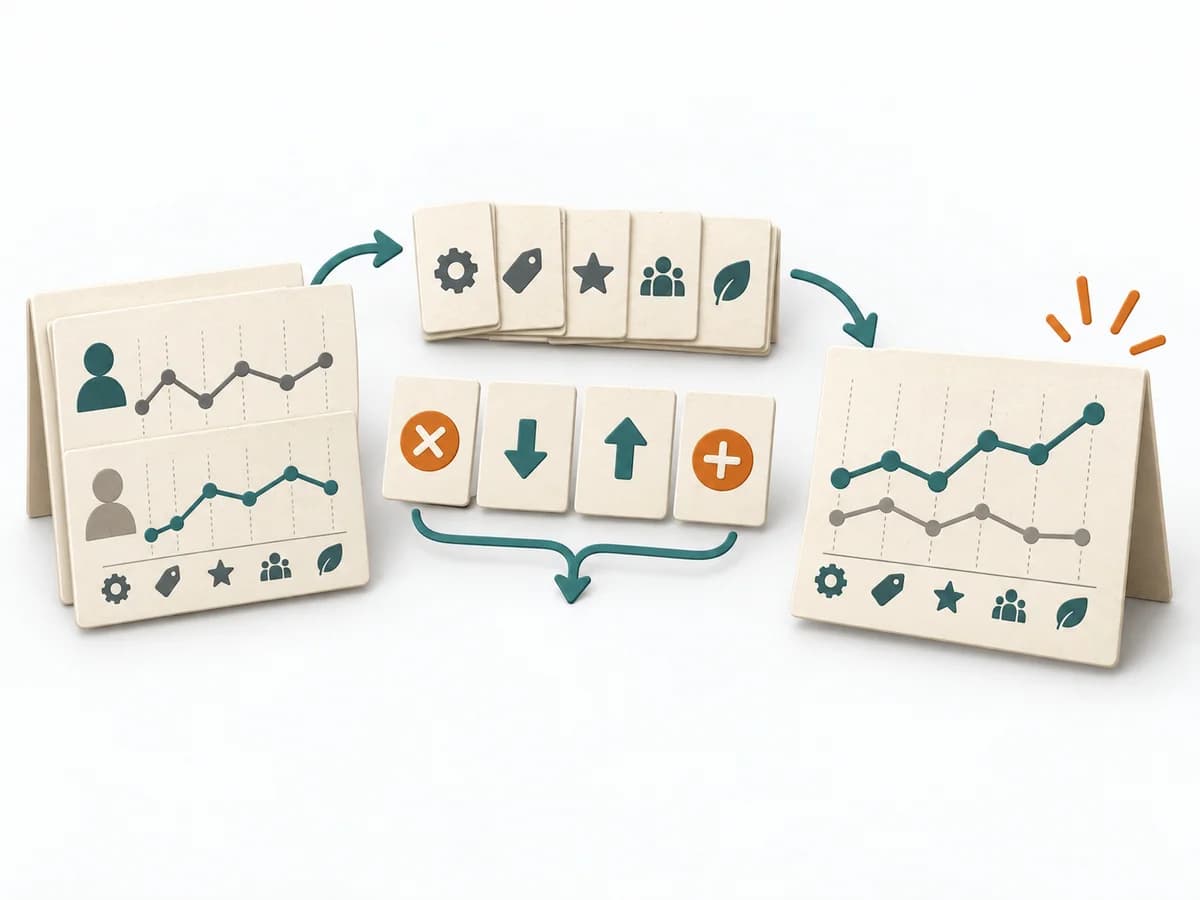 Business Strategy Blue Ocean Strategy Canvas |  Business Strategy Ansoff Matrix |
|---|---|---|---|---|
Purposedifferent | When the value proposition and customer expectation drift apart, it makes fit and mismatch legible. It shows where offering and need don't yet come together. | When growth ideas surface quickly, the temptation to build immediately instead of learning is high. A Growth Experiment frames an assumption so target group, lever, and measurement are clear before the first deployment. | The Blue Ocean Strategy Canvas shows how an offering is positioned relative to the market. Differentiation thereby becomes tangible in value factors instead of merely being claimed. | The Ansoff Matrix organizes growth options by market and product relation. It helps weigh expansion, diversification, and adaptation cleanly against each other. |
Complexitydifferent | Medium | Medium | Medium | Low |
Timedifferent | 1-2 h | 1-2 Wochen | 2-4 h | 45-90 min |
Participantsdifferent | 2-8 | 1-6 | 3-10 | 2-8 |
Formatdifferent | Workshop + async | Workshop + async | Workshop | Workshop + async |
Outputdifferent | Value Proposition Canvas, Fit Gaps, Hypotheses | Experiment card, Result summary, Next bet | Strategy Canvas, Value Curve, ERRC Actions | Ansoff Matrix, Growth Options, Risk Notes |
Tagsno overlap | ValueNeedsStrategy | MarketingGrowthExperimentsLearning | StrategyPositioningInnovationValue | GrowthStrategyMarketPortfolio |