View methods side by side.
Choose up to four methods. Add them using the search and share the comparison by copying its link.
| Criterion |  UX Research User Interviews |  UX Research Personas | 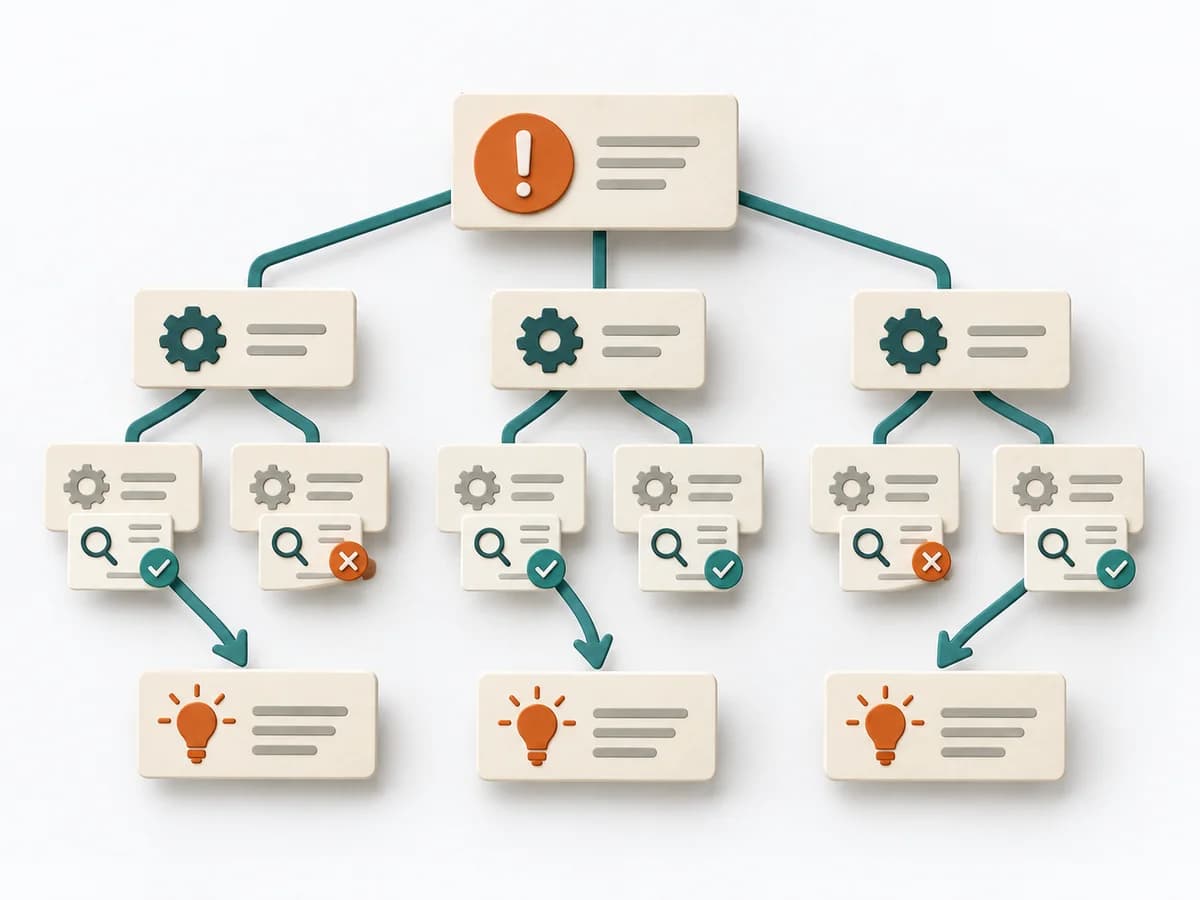 Operations Root Cause Tree Analysis |  UX Research Affinity Diagramming |
|---|---|---|---|---|
Purposedifferent | When teams derive needs only from assumptions and real motives are missing, user interviews give direct access to behavior and meaning. Conversations from the target group's everyday life make patterns, tensions, and open questions solidly visible. | When target groups stay too vague and teams talk about the same people differently, personas create a shared, solid picture of usage. Condensed profiles make needs, contexts, and differences tangible enough for decisions. | For a problem with several suspected causes, the method builds a causal structure instead of a mere list. It makes visible how causes connect and where the strongest points of leverage lie. | When research notes, feedback, or observations sit unconnected side by side, affinity diagramming sorts the raw material into solid themes. Many individual points turn into patterns that make decisions and opportunities clearer. |
Complexitydifferent | Low | Medium | Medium | Low |
Timedifferent | 30–60 min per interview | 1-3 Tage | 1-3 h | 45–90 min |
Participantsdifferent | 1 participant per interview | Internes Team | 2-8 | 3-10 |
Formatdifferent | Workshop + async | Workshop + async | Workshop | Workshop |
Outputdifferent | Interview Notes, Themes, Insight Summary | Persona Profiles, Needs Summary, Scenario Notes | Cause Tree, Evidence Notes, Countermeasures | Theme clusters, Insight statements, Opportunity areas |
Tagsno overlap | QualitativeResearchCustomerDiscovery | ResearchCustomerSynthesis | Root causeTreeIncidentQuality | SynthesisQualitativeRoot cause |