View methods side by side.
Choose up to four methods. Add them using the search and share the comparison by copying its link.
| Criterion | 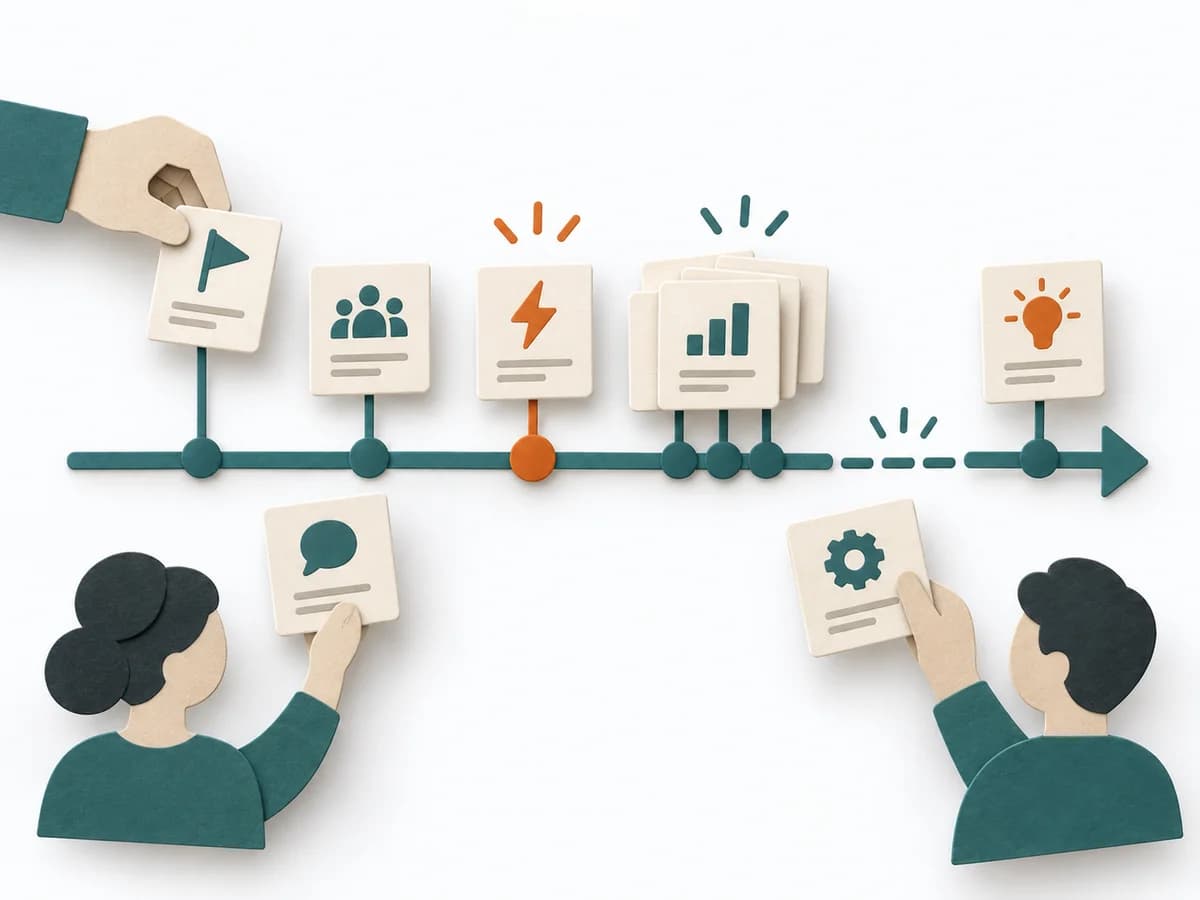 Facilitation Timeline | 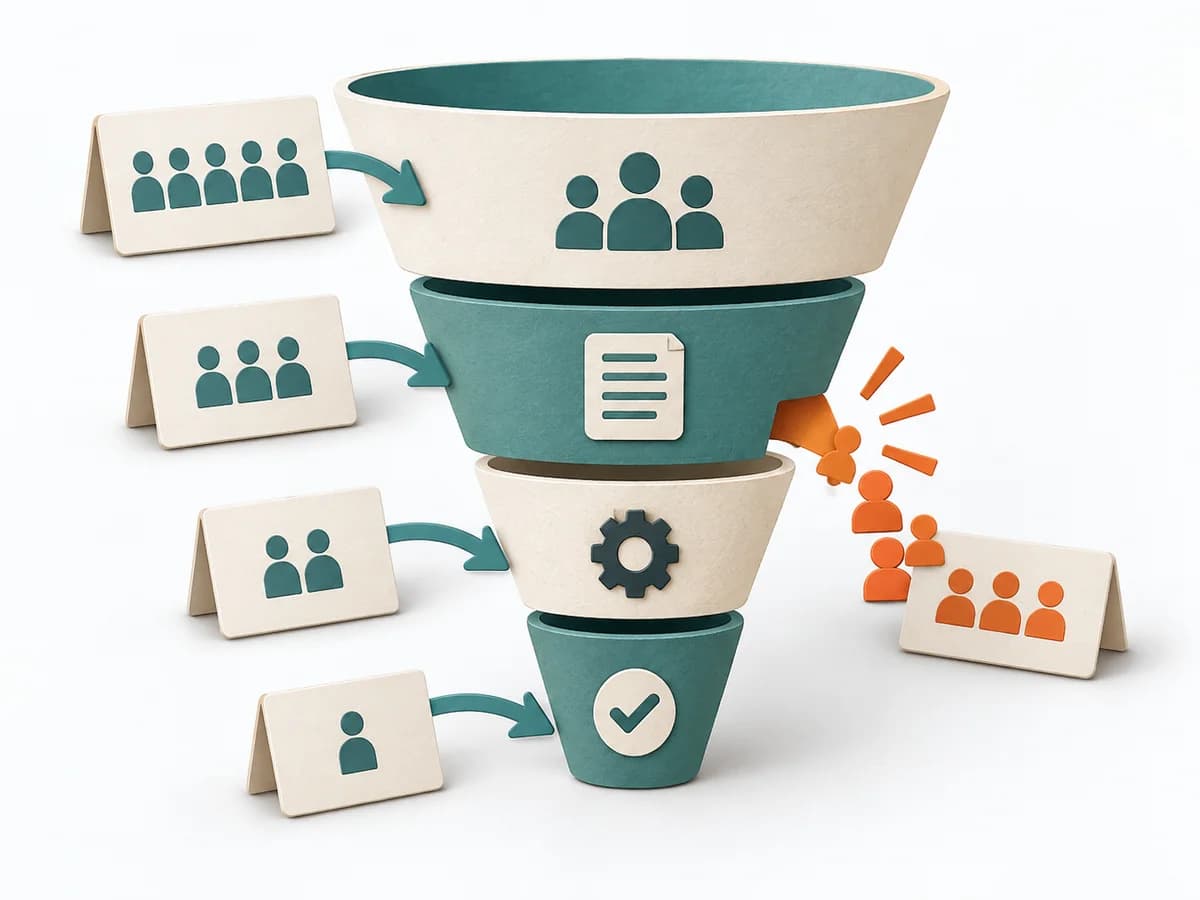 Growth Funnel Analysis |  Facilitation Alignment Mapping |  Facilitation 3-Circle Venn Diagram |
|---|---|---|---|---|
Purposedifferent | When a project, incident, or change process is only remembered in fragments, Timeline brings the sequence back into a readable form. It makes turning points, precursors, and after-effects recognizable over the course of time. | When many visitors or users drop off along the way, the reason behind the number often stays hidden. Funnel Analysis exposes these transitions and makes visible exactly where the path collapses. | When several people work toward one goal but hold different mental maps, Alignment Mapping makes the discrepancies visible. It arranges goals, assumptions, and priorities so shared direction becomes verifiable. | When three perspectives matter at the same time, a Three-Circle Venn Diagram shows the overlaps and remainders precisely. It makes visible where shared effect arises and where only a partial perspective applies. |
Complexitydifferent | Low | Medium | Medium | Low |
Timedifferent | 30-90 min | 1-3 h | 1-2 h | 15-45 min |
Participantsdifferent | 2-12 | 1-5 | 4-12 | 2-8 |
Formatdifferent | Workshop + async | Async | Workshop | Workshop + async |
Outputdifferent | Timeline, Milestones, Insight Notes | Funnel report, Drop-off analysis, Optimization hypotheses | Alignment Map, Open Issues, Decision Questions | Venn Diagram, Overlap Notes, Differentiators |
Tagsno overlap | TimelineFacilitationSequence | AnalyticsConversionGrowth | AlignmentStakeholdersStrategyFacilitation | ComparisonFacilitationAlignment |