View methods side by side.
Choose up to four methods. Add them using the search and share the comparison by copying its link.
| Criterion | 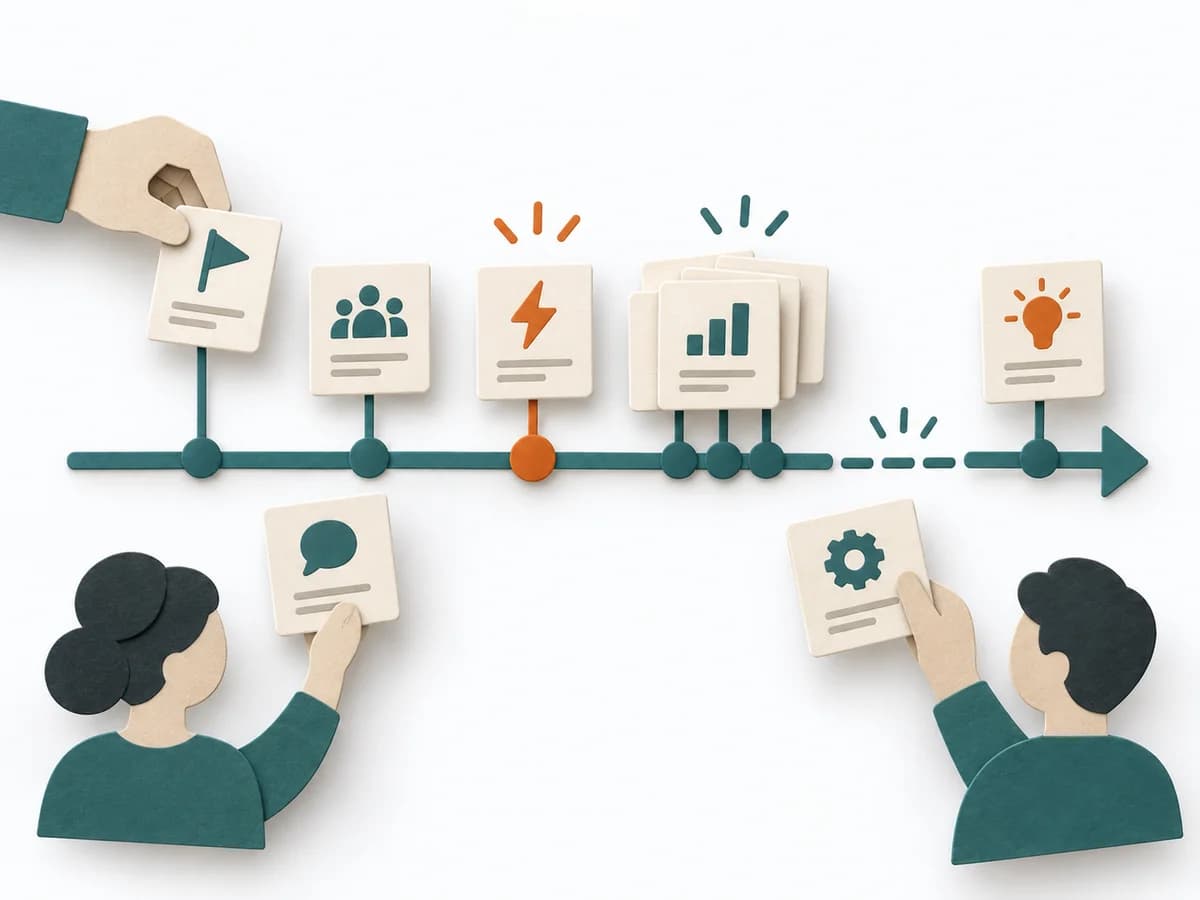 Facilitation Timeline | 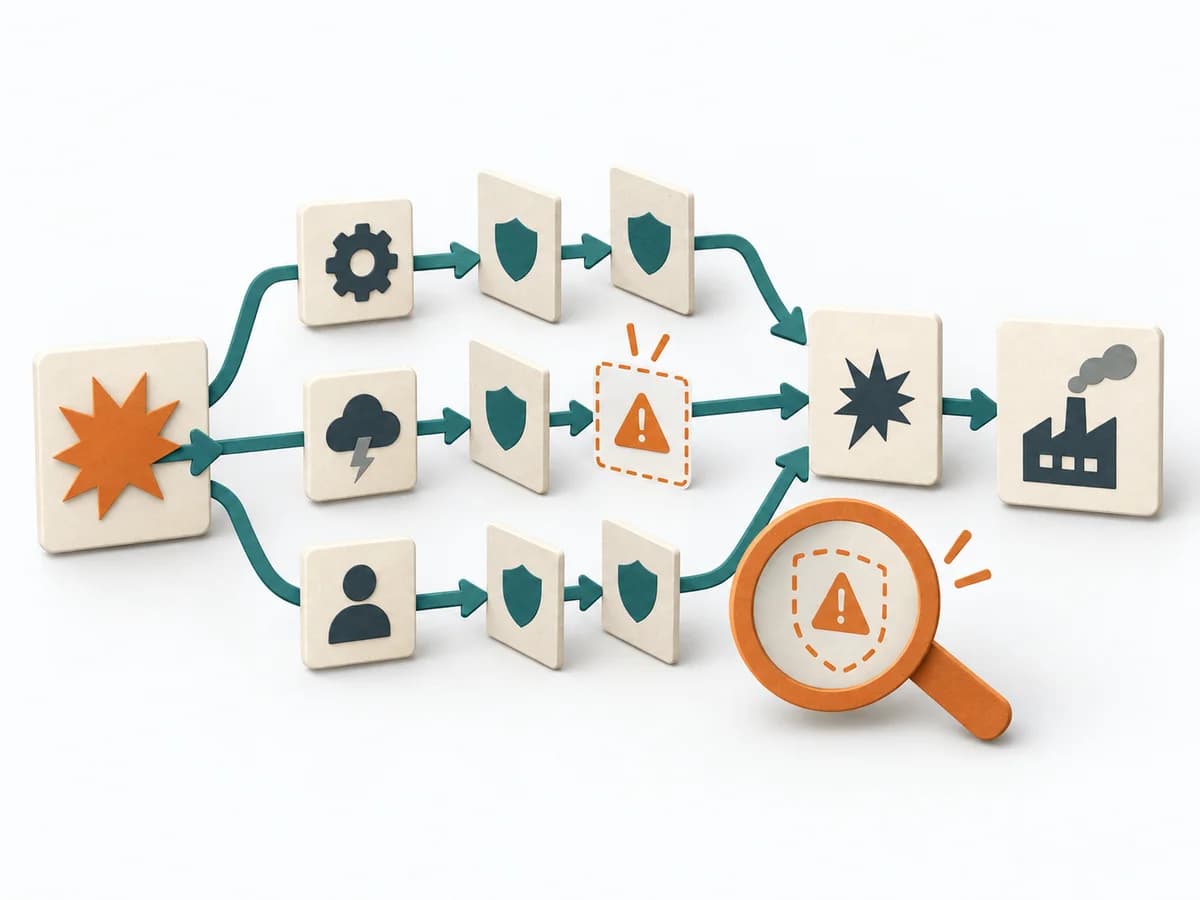 Engineering Failure Scenario Analysis | 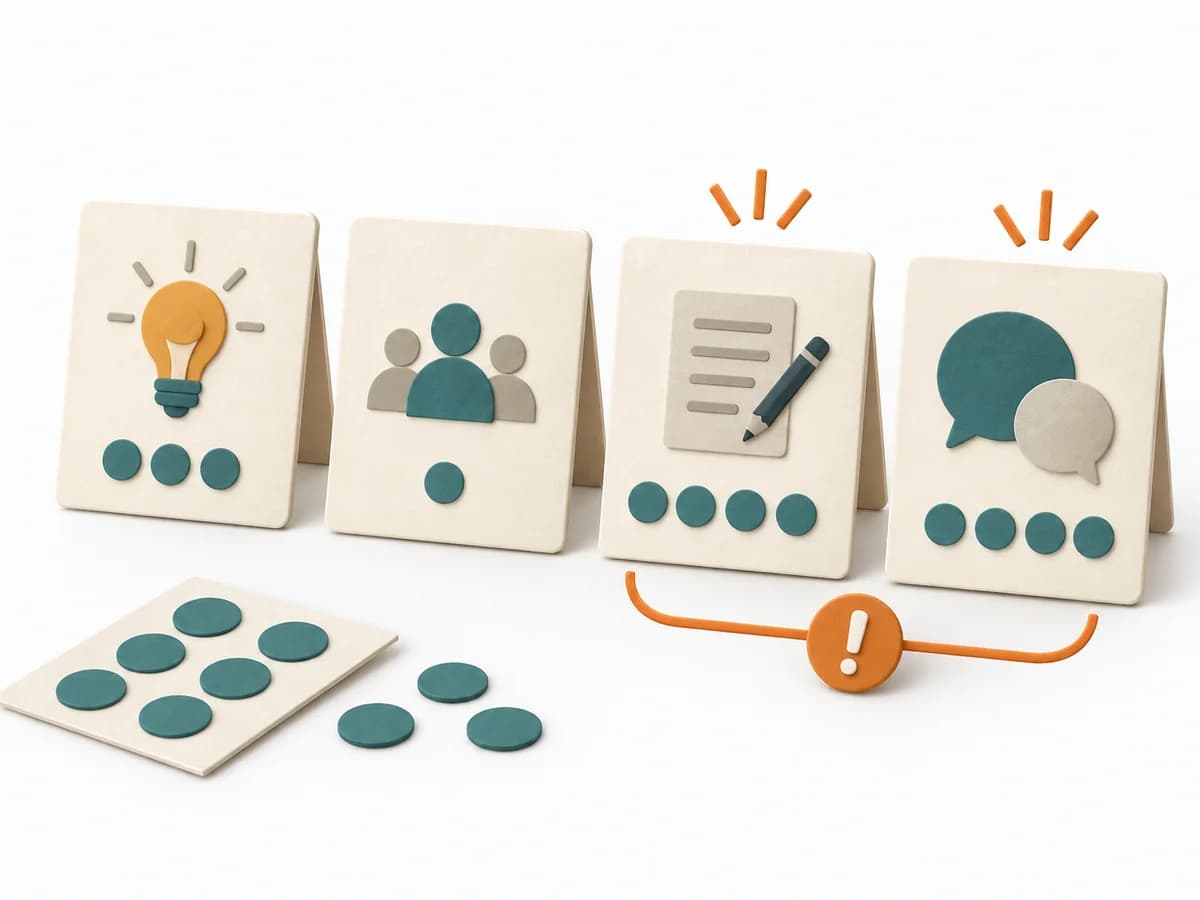 Facilitation Dot Voting | 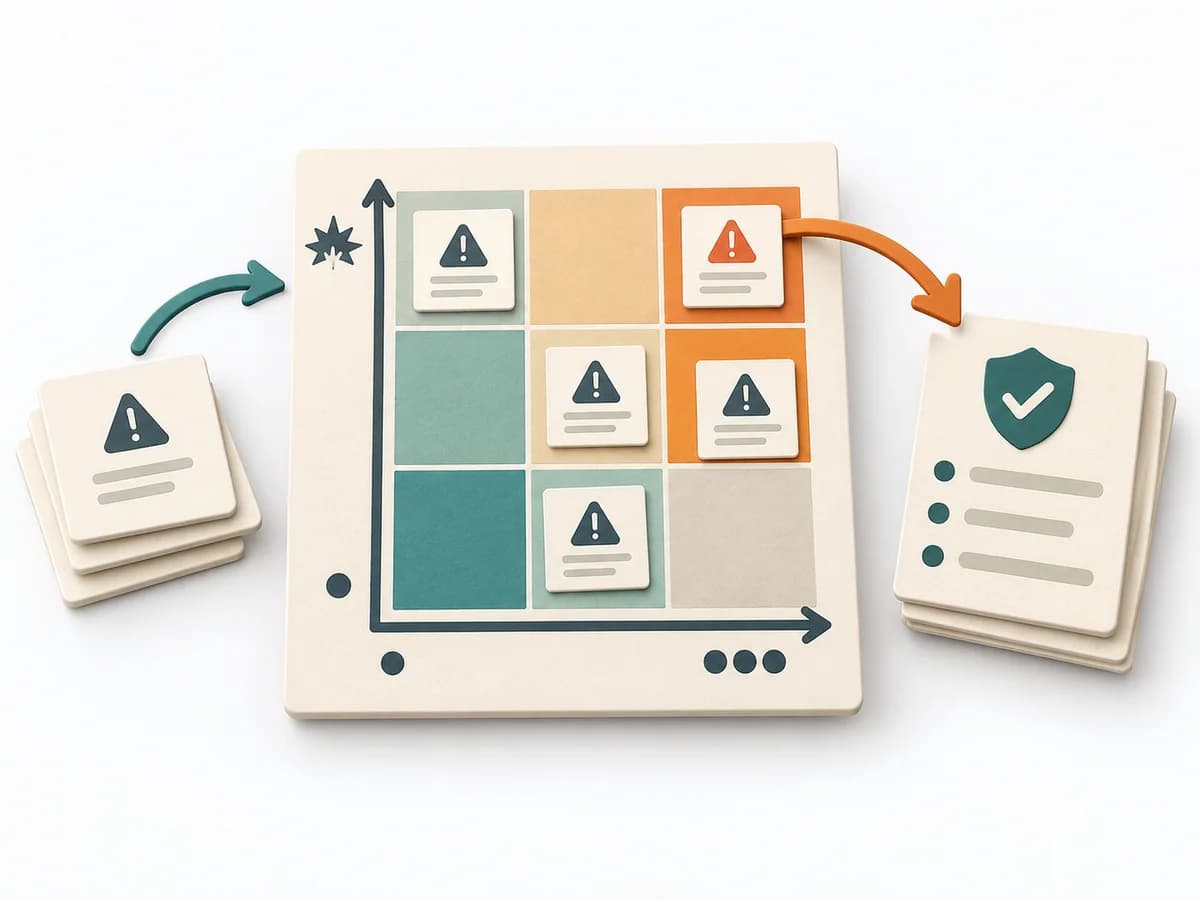 Decision Making Risk Matrix |
|---|---|---|---|---|
Purposedifferent | When a project, incident, or change process is only remembered in fragments, Timeline brings the sequence back into a readable form. It makes turning points, precursors, and after-effects recognizable over the course of time. | In critical processes, it is not enough to plan only for the normal case. Failure Scenario Analysis looks at the path into failure and shows which failures, chains, and control gaps cause the most damage. | When a workshop has produced too many options and the group needs to condense quickly, dot voting makes preferences visible in a short time. It bundles individual votes into a solid signal for the next selection. | When a project faces many possible disruptions, it quickly becomes unclear which risks deserve attention first. It separates options, evaluation criteria, and open risks. The result is captured as a Risk Matrix and a Top Risk List. |
Complexitydifferent | Low | Medium | Low | Low |
Timedifferent | 30-90 min | 1-3 h | 5-15 min | 30-60 min |
Participantsdifferent | 2-12 | 3-8 | 3-20 | 3-10 |
Formatdifferent | Workshop + async | Workshop | Workshop | Workshop + async |
Outputdifferent | Timeline, Milestones, Insight Notes | Failure Scenarios, Risk Notes, Control Gaps, Test and Response Actions | Ranked list, Consensus signal, Shortlist | Risk Matrix, Top Risk List |
Tagsno overlap | TimelineFacilitationSequence | FailureResilienceRisk | FacilitationVotingConsensusPrioritization | RiskDecisionPrioritizationAssessment |