View methods side by side.
Choose up to four methods. Add them using the search and share the comparison by copying its link.
| Criterion | 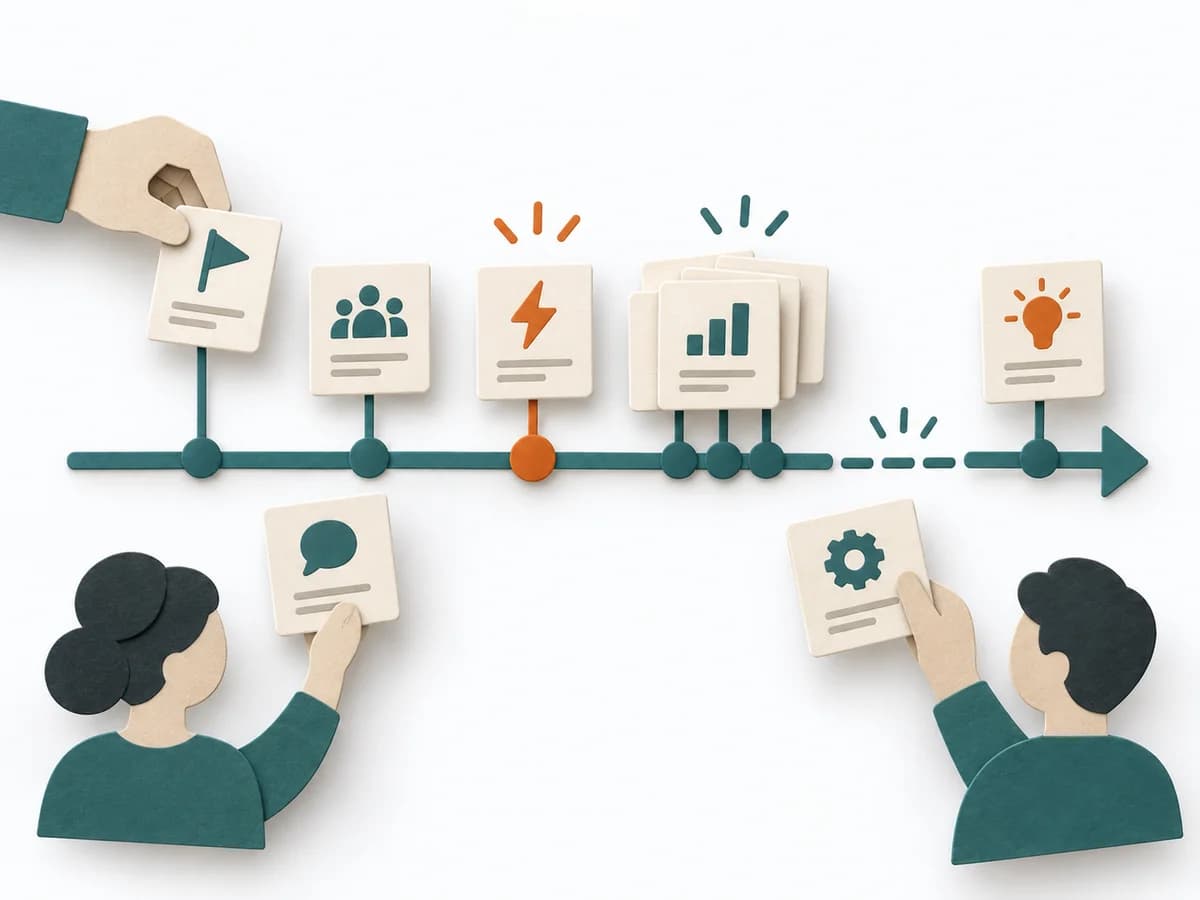 Facilitation Timeline | 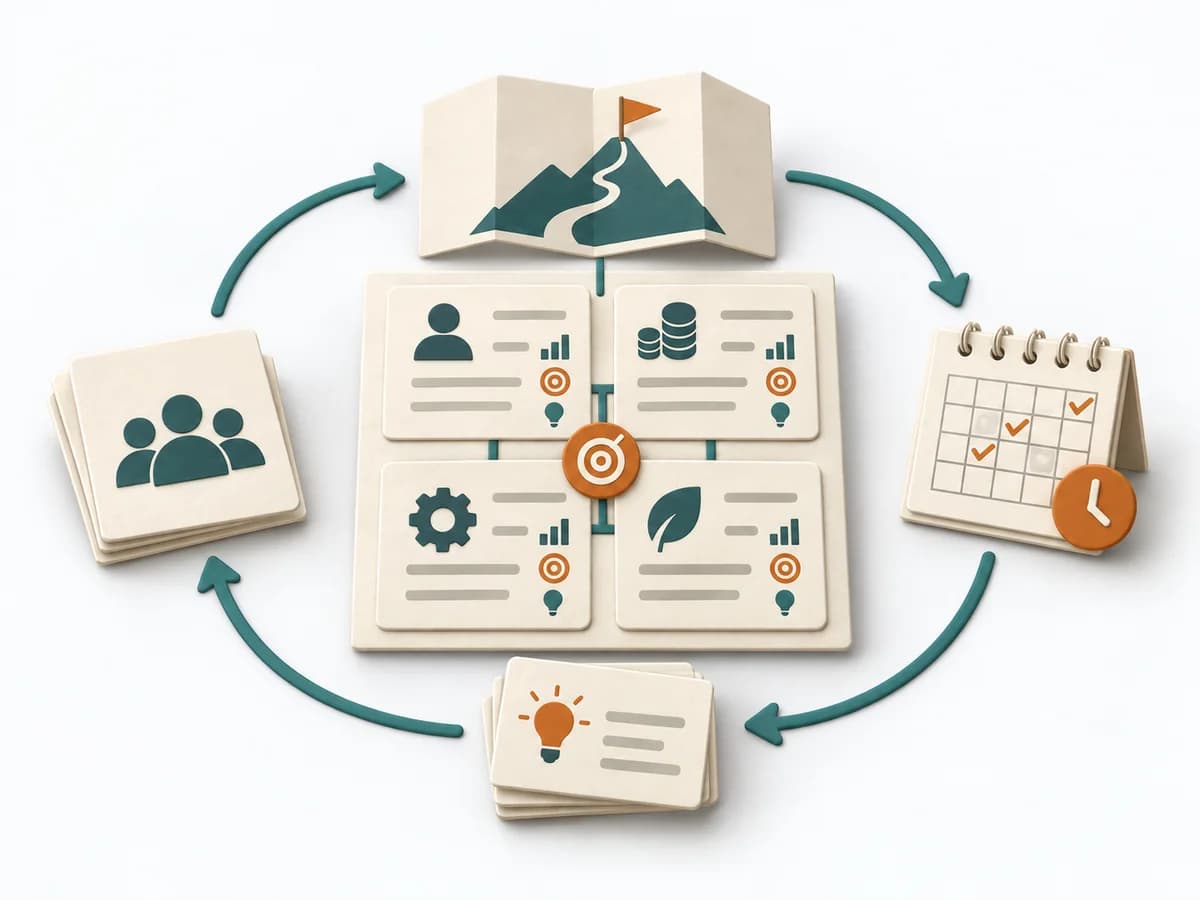 Business Strategy Balanced Scorecard | 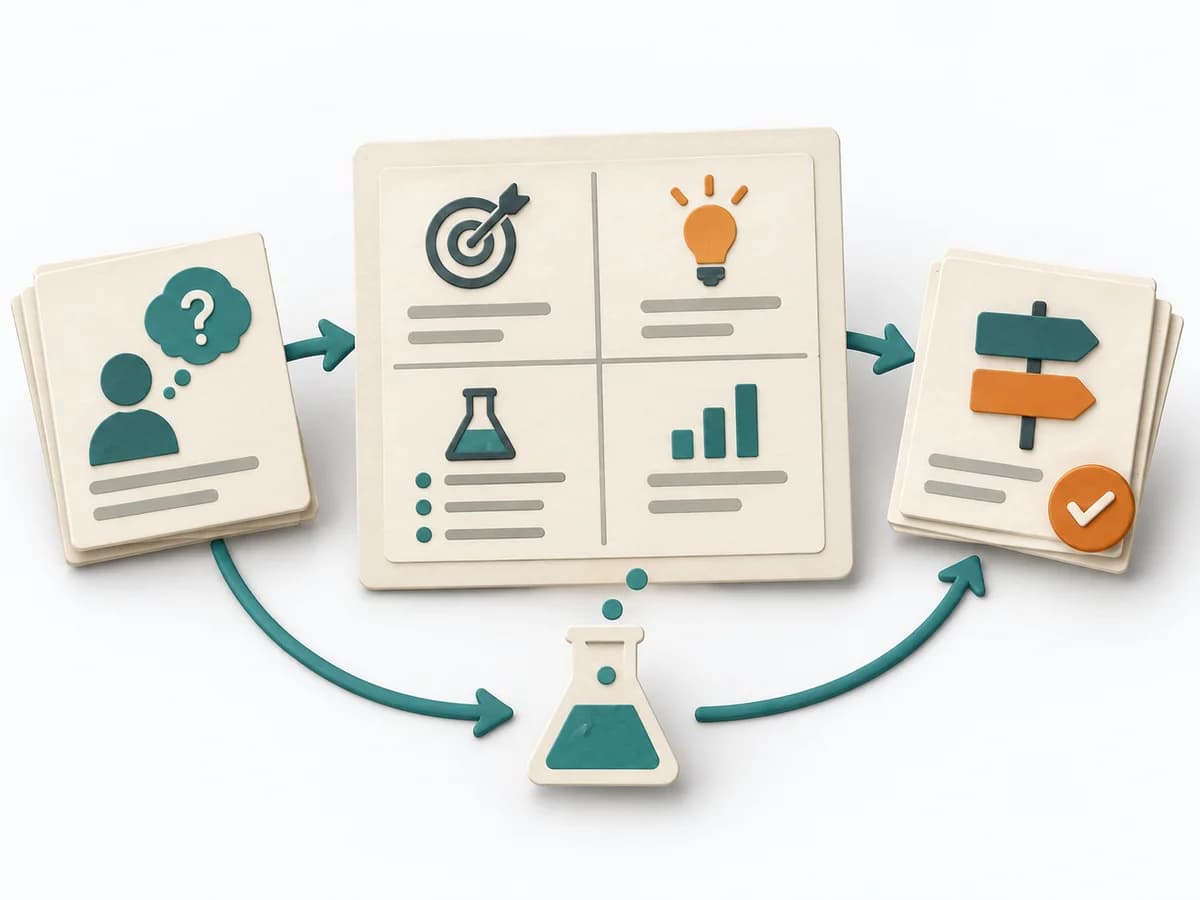 Product Discovery Experiment Canvas | 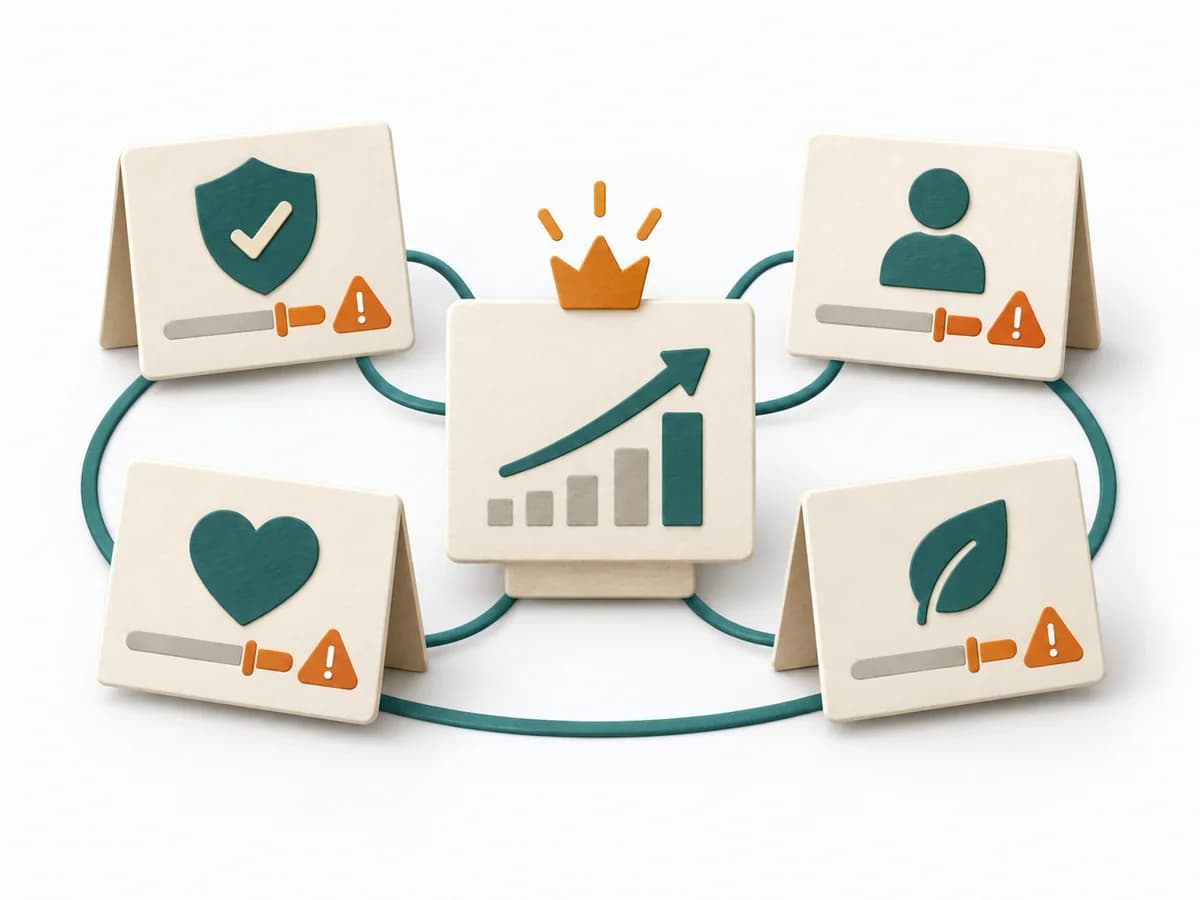 Product Strategy Counter Metrics |
|---|---|---|---|---|
Purposedifferent | When a project, incident, or change process is only remembered in fragments, Timeline brings the sequence back into a readable form. It makes turning points, precursors, and after-effects recognizable over the course of time. | Balanced Scorecard translates strategy into a few interconnected perspectives and metrics. It holds impact, steering, and learning together in daily work instead of narrowing strategy down to financial figures. | When experiments become unreadable after the fact, it arranges hypothesis, signal, and learning goal on a single canvas. It separates problem, assumption, solution, and evidence. The result is captured as a Completed Experiment Canvas and a Success Metric. | When a headline metric could mask side effects, it adds guardrail signals against unwanted outcomes. It connects customer value, product logic, and decision priorities. The result is captured as a counter-metric list and guardrail definitions. |
Complexitydifferent | Low | High | Low | Low |
Timedifferent | 30-90 min | Halber Tag bis mehrere Wochen | 30-60 min | 30-60 min |
Participantsdifferent | 2-12 | 4-12 | 1-5 | 2-6 |
Formatsame | Workshop + async | Workshop + async | Workshop + async | Workshop + async |
Outputdifferent | Timeline, Milestones, Insight Notes | Balanced Scorecard, Strategic Measures, Initiative Map | Completed Experiment Canvas, Success Metric | Counter Metric List, Guardrail Definitions |
Tagsno overlap | TimelineFacilitationSequence | StrategyMetricsExecution | ExperimentsValidationDiscoveryHypothesis | MetricsMeasurementStrategyExperiments |