View methods side by side.
Choose up to four methods. Add them using the search and share the comparison by copying its link.
| Criterion | 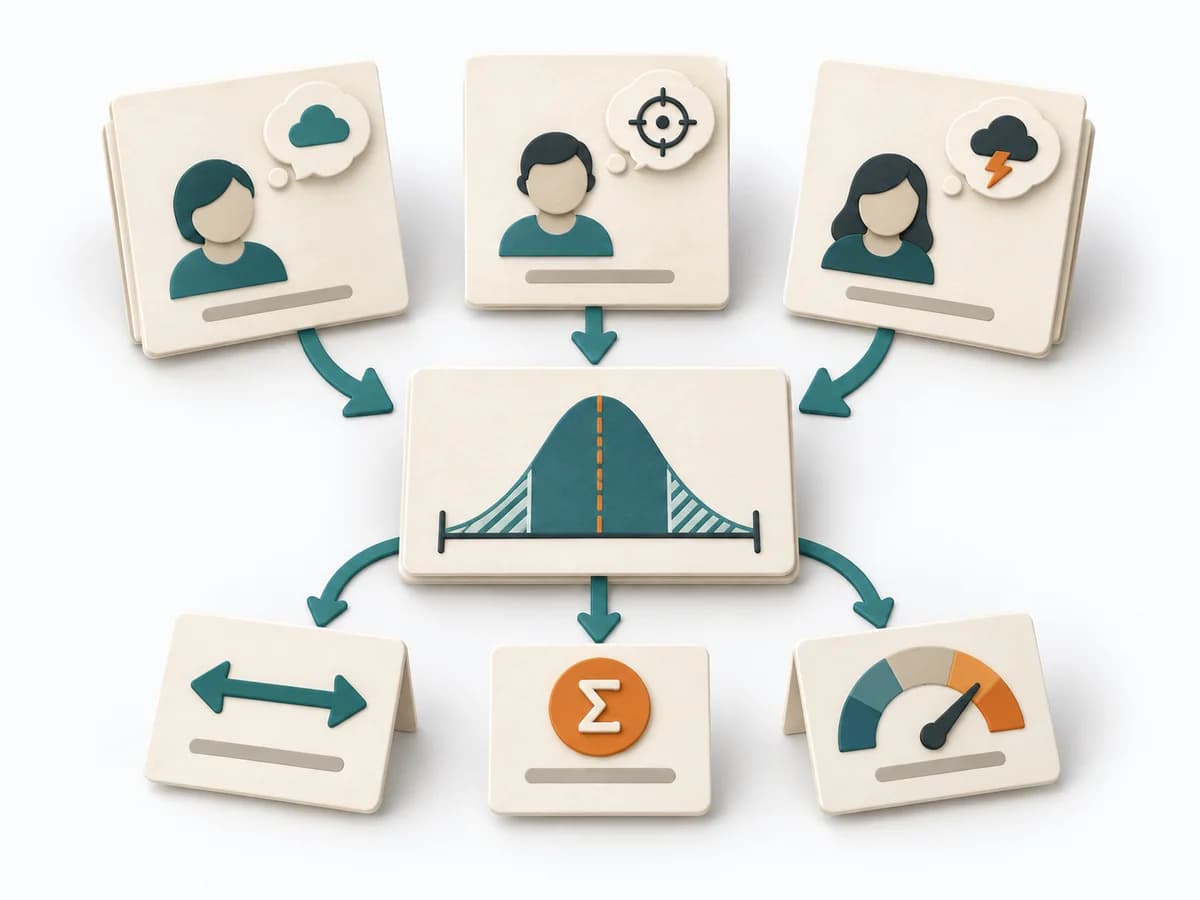 Decision Making Three-Point Estimation |  Delivery Monte Carlo Forecasting | 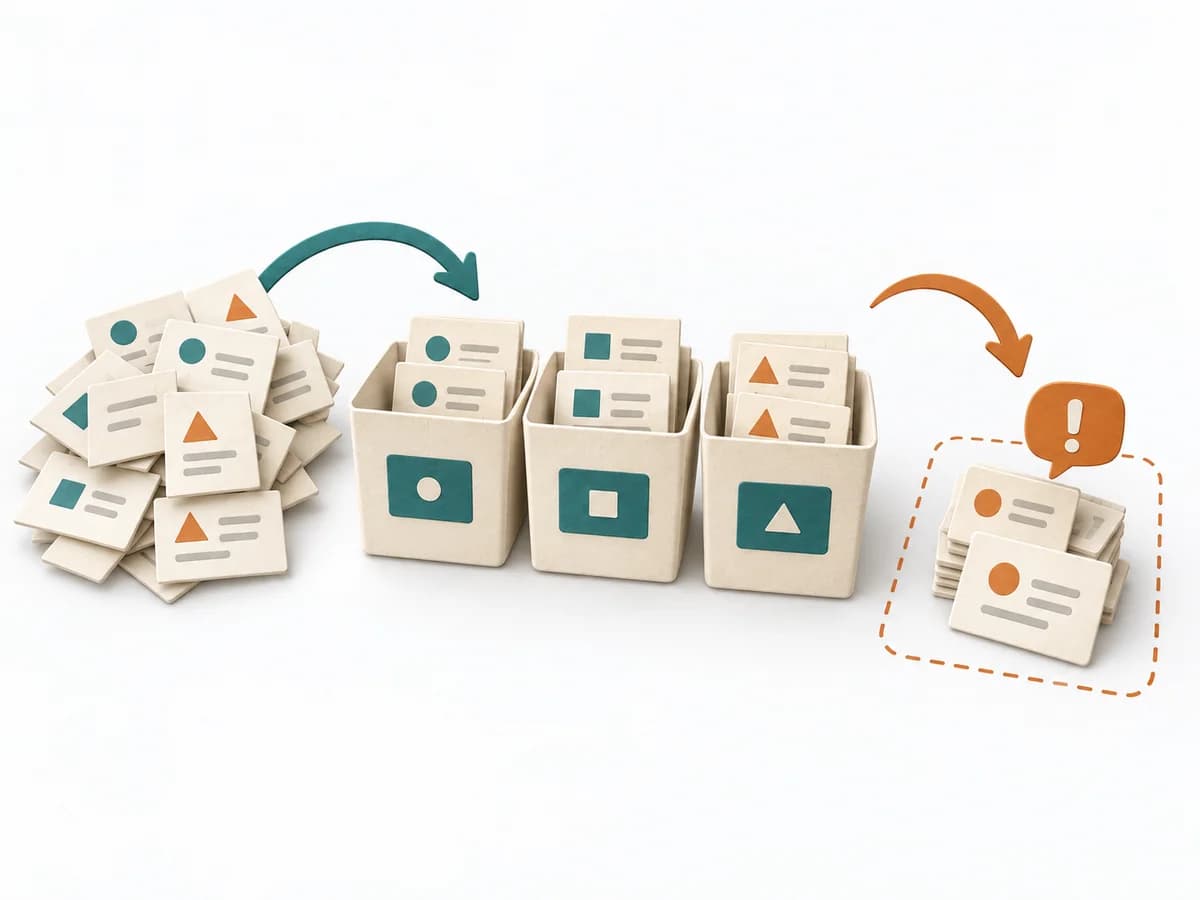 Agile Bucket System | 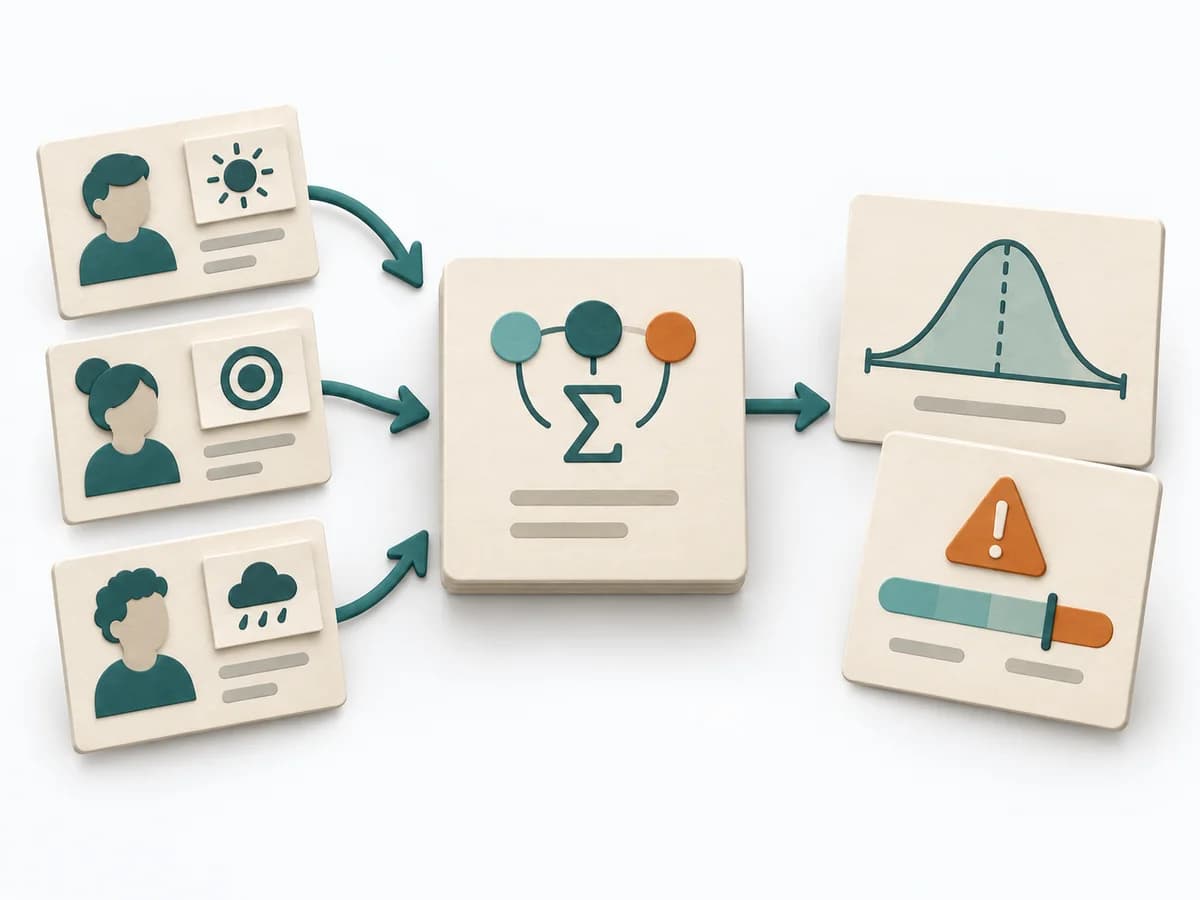 Decision Making PERT Estimation |
|---|---|---|---|---|
Purposedifferent | A single estimate for effort, time, or risk often looks too smooth for the real uncertainty behind it. It separates options, evaluation criteria, and open risks. The result is captured as a Three-Point Estimate, Risk Range, and Assumption Notes. | Helps clarify scope, sequence, and delivery flow in concrete terms. It makes work, boundaries, and order steerable. The result is captured as Forecast Percentiles, Throughput Dataset, and Risk Communication. | When a large batch of work needs a fast, rough estimate, it sorts items into predefined size buckets. It sorts work by value, risk, and delivery ability. The result is captured as a Bucketed Backlog, Relative Estimates, and Split Candidates. | On complex initiatives, a plain average tends to understate just how uncertain the outcome really is. It separates options, evaluation criteria, and open risks. The result is captured as a PERT Estimate, Expected Value, and Risk Notes. |
Complexitydifferent | Medium | High | Medium | Medium |
Timedifferent | 10-30 min je Item | 30-90 min Setup, danach laufend | 30-90 min | 15-45 min |
Participantsdifferent | 1-8 | 1-8 | 3-12 | 1-8 |
Formatdifferent | Workshop + async | Workshop + async | Workshop | Workshop + async |
Outputdifferent | Three-Point Estimate, Risk Range, Assumption Notes | Forecast Percentiles, Throughput Dataset, Risk Communication | Bucketed Backlog, Relative Estimates, Split Candidates | PERT Estimate, Expected Value, Risk Notes |
Tagsno overlap | EstimationUncertaintyForecasting | ForecastingFlowDelivery | EstimationBacklogRelative sizing | EstimationUncertaintyRisk |