View methods side by side.
Choose up to four methods. Add them using the search and share the comparison by copying its link.
| Criterion | 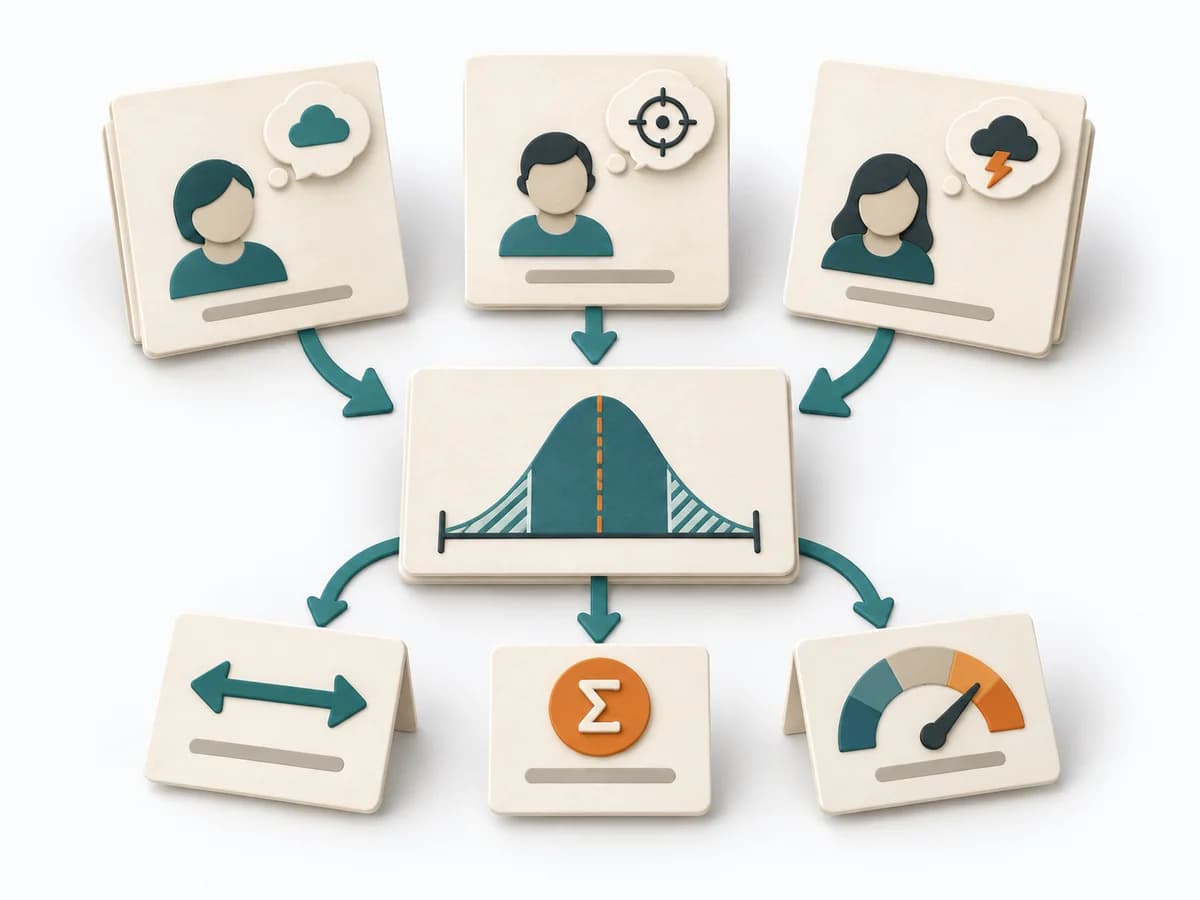 Decision Making Three-Point Estimation |  Business Strategy Ansoff Matrix |  Business Strategy PESTLE Analysis |  Agile NoEstimates |
|---|---|---|---|---|
Purposedifferent | A single estimate for effort, time, or risk often looks too smooth for the real uncertainty behind it. It separates options, evaluation criteria, and open risks. The result is captured as a Three-Point Estimate, Risk Range, and Assumption Notes. | The Ansoff Matrix organizes growth options by market and product relation. It helps weigh expansion, diversification, and adaptation cleanly against each other. | PESTLE Analysis makes political, economic, social, technological, legal, and environmental influences visible. The environment of an initiative is thereby read systematically instead of through isolated trends. | When estimating slows a team down more than it helps, it shifts the focus to flow, small slices, and real lead time. It sorts work by value, risk, and delivery ability. The result is captured as Throughput Data, Flow Forecast, and Slicing Rules. |
Complexitydifferent | Medium | Low | Medium | Medium |
Timedifferent | 10-30 min je Item | 45-90 min | 1-3 h | laufend |
Participantsdifferent | 1-8 | 2-8 | 2-10 | 2-12 |
Formatsame | Workshop + async | Workshop + async | Workshop + async | Workshop + async |
Outputdifferent | Three-Point Estimate, Risk Range, Assumption Notes | Ansoff Matrix, Growth Options, Risk Notes | PESTLE Map, External Risks, Strategic Questions | Throughput Data, Flow Forecast, Slicing Rules |
Tagsno overlap | EstimationUncertaintyForecasting | GrowthStrategyMarketPortfolio | StrategyMarketAnalysis | EstimationForecastingFlow |