View methods side by side.
Choose up to four methods. Add them using the search and share the comparison by copying its link.
| Criterion | 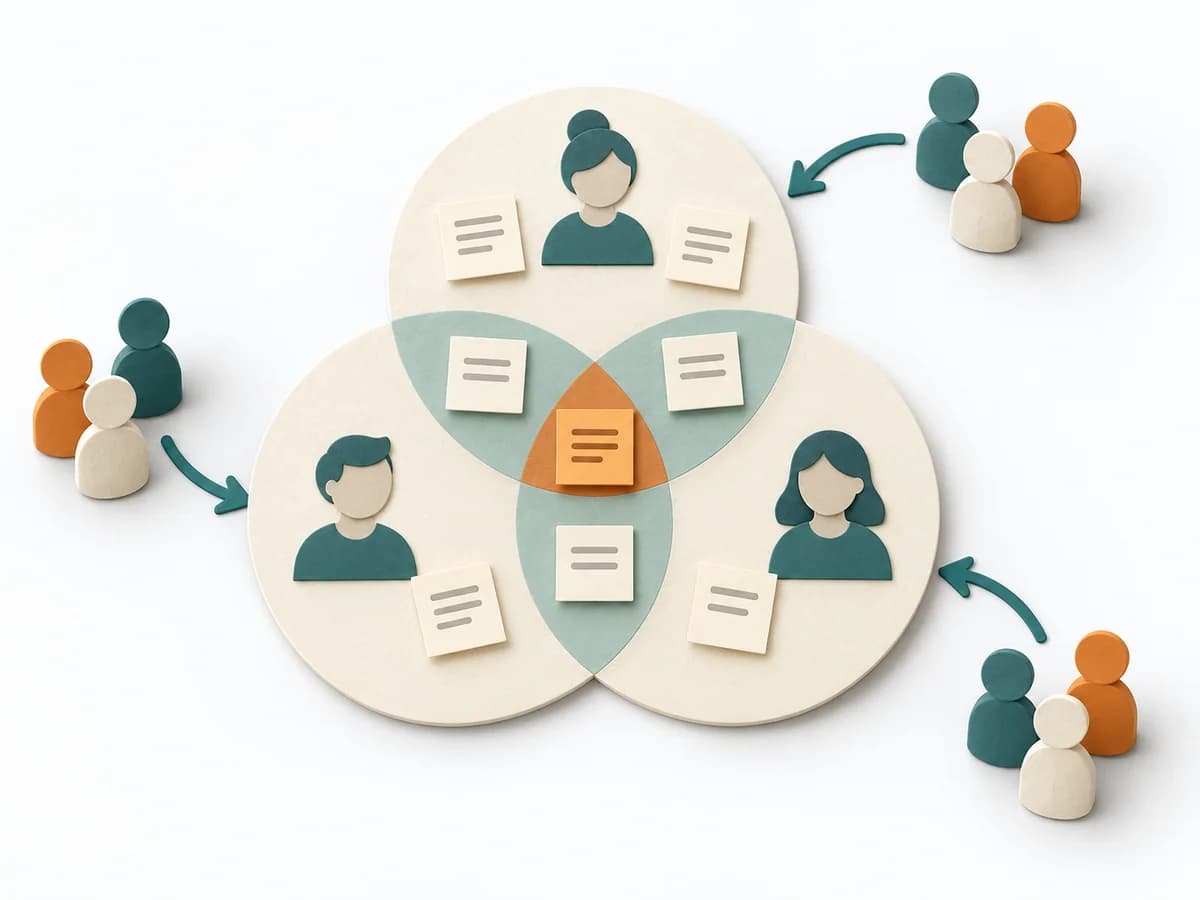 Facilitation 3-Circle Venn Diagram |  Agile NoEstimates |  Facilitation Alignment Mapping | 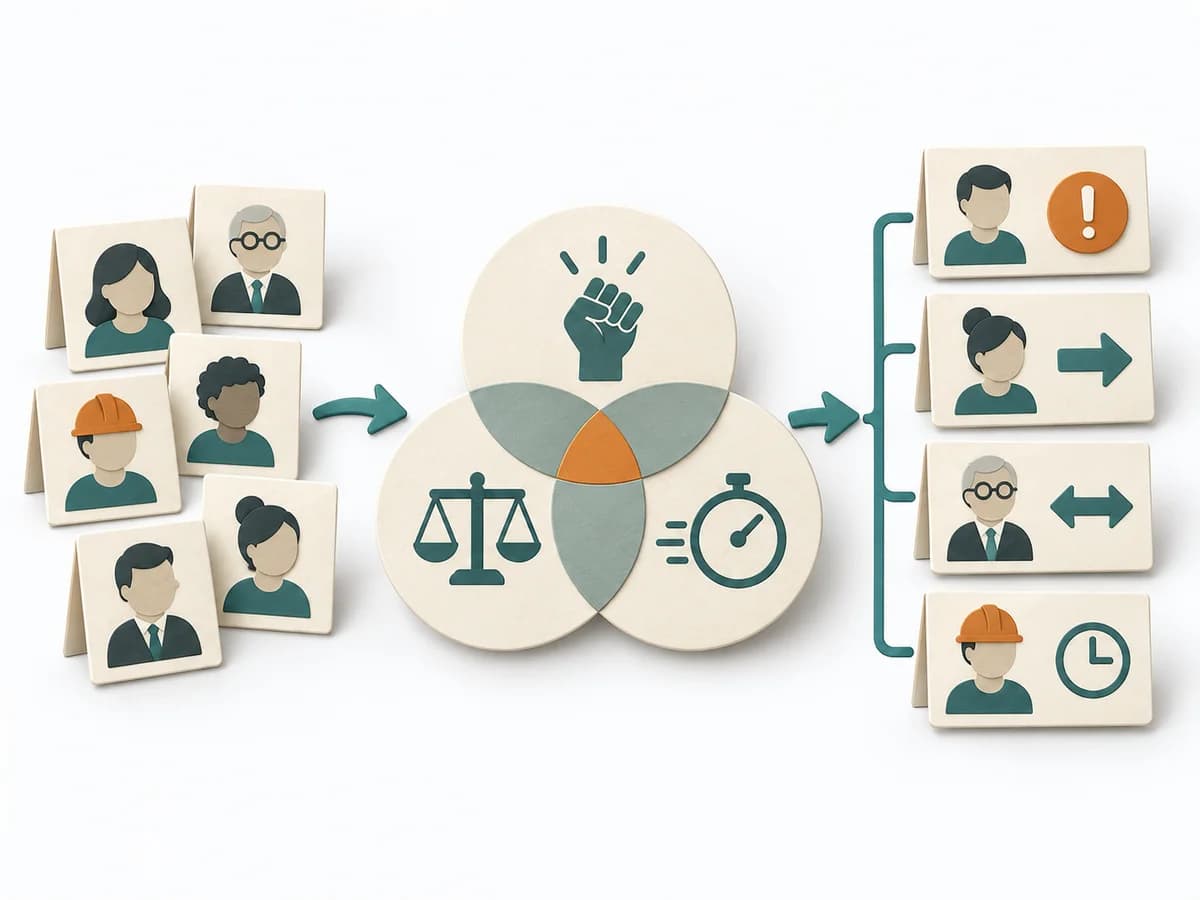 Facilitation Stakeholder Salience Model |
|---|---|---|---|---|
Purposedifferent | When three perspectives matter at the same time, a Three-Circle Venn Diagram shows the overlaps and remainders precisely. It makes visible where shared effect arises and where only a partial perspective applies. | When estimating slows a team down more than it helps, it shifts the focus to flow, small slices, and real lead time. It sorts work by value, risk, and delivery ability. The result is captured as Throughput Data, Flow Forecast, and Slicing Rules. | When several people work toward one goal but hold different mental maps, Alignment Mapping makes the discrepancies visible. It arranges goals, assumptions, and priorities so shared direction becomes verifiable. | When stakeholders appear to matter very differently, the Stakeholder Salience Model rates their actual priority through power, legitimacy, and urgency. It turns individual contributions into a visible selection. The result is captured as a Salience diagram and a class-based strategy. |
Complexitydifferent | Low | Medium | Medium | Medium |
Timedifferent | 15-45 min | laufend | 1-2 h | 60-90 min |
Participantsdifferent | 2-8 | 2-12 | 4-12 | 3-6 |
Formatdifferent | Workshop + async | Workshop + async | Workshop | Workshop |
Outputdifferent | Venn Diagram, Overlap Notes, Differentiators | Throughput Data, Flow Forecast, Slicing Rules | Alignment Map, Open Issues, Decision Questions | Salience Diagram, Strategy per Class |
Tagsno overlap | ComparisonFacilitationAlignment | EstimationForecastingFlow | AlignmentStakeholdersStrategyFacilitation | StakeholdersFacilitationAlignmentGovernance |