View methods side by side.
Choose up to four methods. Add them using the search and share the comparison by copying its link.
| Criterion |  Systems Thinking System Dynamics Simulation |  Decision Making OODA Loop |  Systems Thinking Leverage Points | 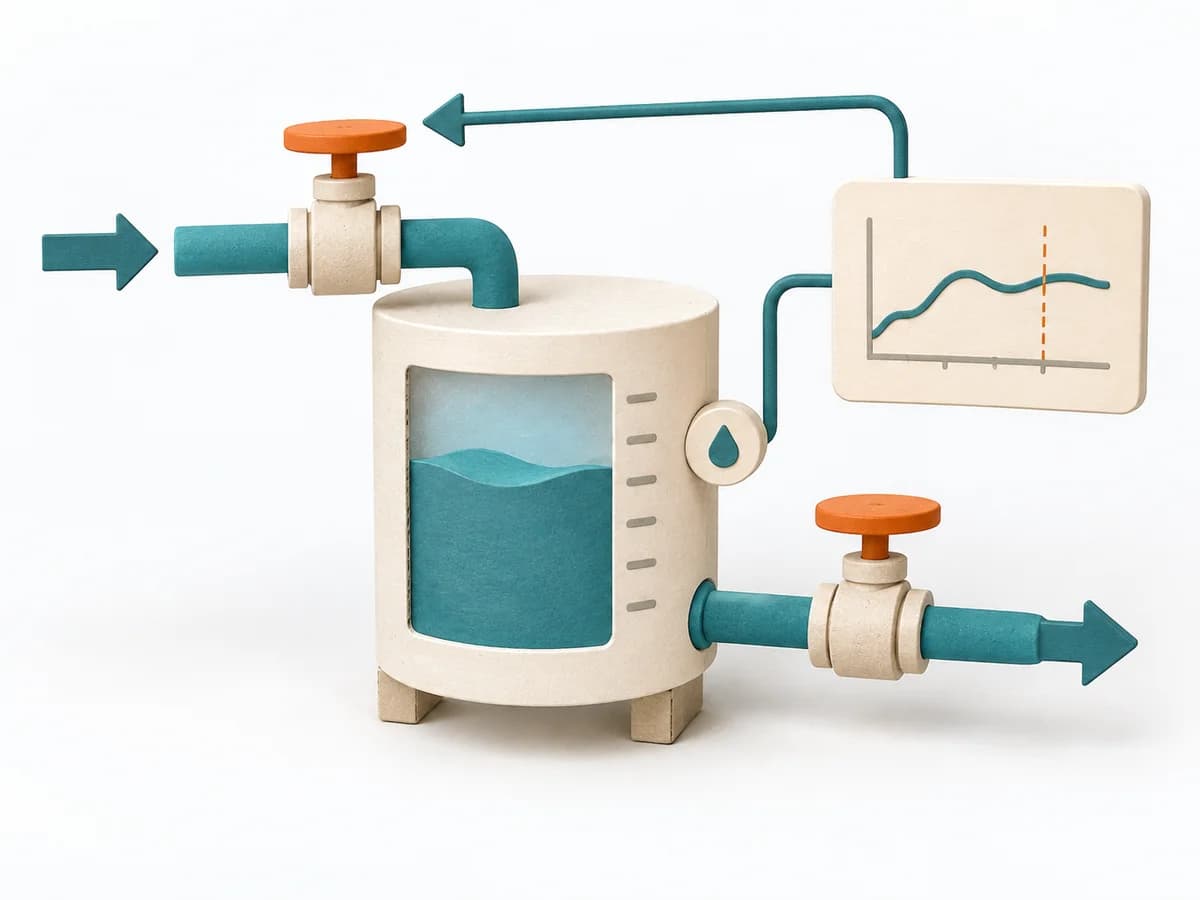 Systems Thinking Stock and Flow Diagram |
|---|---|---|---|---|
Purposedifferent | System Dynamics Simulation makes assumptions about time, delay, and feedback testable through experiments. It draws relationships, patterns, and feedback loops. The result is captured as a simulation model and scenario reports. | In dynamic situations, decisions become outdated faster than they can be prepared. The OODA Loop holds observing, orienting, deciding, and acting together as a recurring rhythm so reaction does not slide into inertia. | Leverage Points show exactly where interventions in a system produce a disproportionate effect. It draws relationships, patterns, and feedback loops. The result is captured as a leverage map and action strategy. | A Stock and Flow Diagram shows how stocks, inflows, and outflows shape a system over time. It is especially suited when growth, delays, or capacity limits determine the dynamics. |
Complexitydifferent | High | Medium | High | High |
Timedifferent | Mehrere Tage bis Wochen | 15-60 min je Zyklus | Half day | 2-6 h |
Participantsdifferent | 1-5 Modellierende, Stakeholder asynchron | 1-8 | 3-12 | 1-6 |
Formatdifferent | Async | Workshop + async | Workshop | Workshop + async |
Outputdifferent | Simulation Model, Scenario Reports | Situation Assessment, Decision Loop, Action Updates | Leverage Map, Action Strategy | Stock and Flow Model, Dynamics Notes, Simulation Hypotheses |
Tagsno overlap | Systems thinkingDynamicsSimulationAnalysis | DecisionChangeLearningStrategy | Systems thinkingChangeStrategy | DynamicsSimulationFeedbackSystems thinking |