View methods side by side.
Choose up to four methods. Add them using the search and share the comparison by copying its link.
| Criterion | 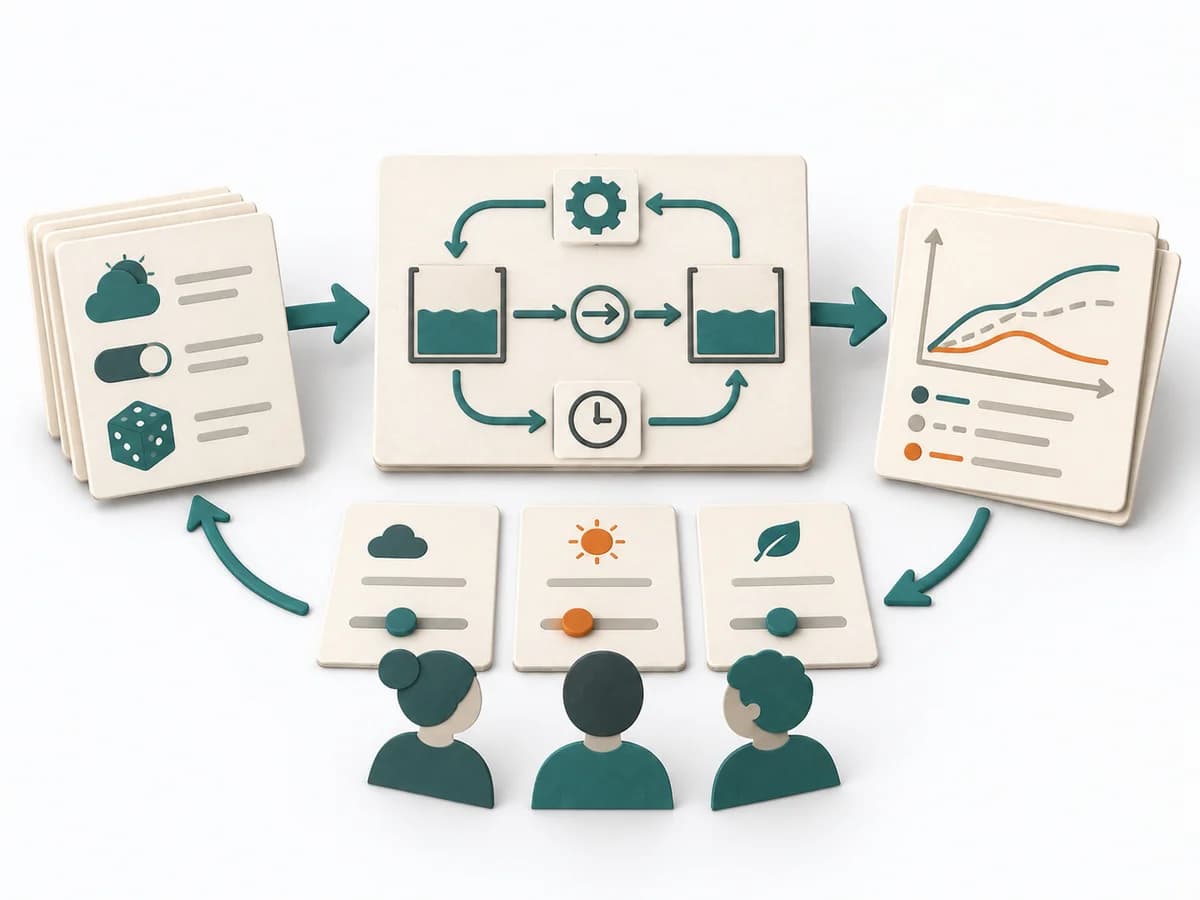 Systems Thinking System Dynamics Simulation |  Operations 5 Whys |  Operations Change Analysis |  Systems Thinking Stock and Flow Diagram |
|---|---|---|---|---|
Purposedifferent | System Dynamics Simulation makes assumptions about time, delay, and feedback testable through experiments. It draws relationships, patterns, and feedback loops. The result is captured as a simulation model and scenario reports. | For a single, hard-to-explain deviation, the method exposes the causal chain behind the visible symptom. It keeps the cause open until a controllable condition emerges instead of a mere description. | For a deviation after a change, the method isolates the influence of the altered condition. It narrows down which differences are relevant and which are just accompanying noise. | A Stock and Flow Diagram shows how stocks, inflows, and outflows shape a system over time. It is especially suited when growth, delays, or capacity limits determine the dynamics. |
Complexitydifferent | High | Low | Medium | High |
Timedifferent | Mehrere Tage bis Wochen | 15-30 min | 45-120 min | 2-6 h |
Participantsdifferent | 1-5 Modellierende, Stakeholder asynchron | 2-6 | 2-6 | 1-6 |
Formatdifferent | Async | Workshop | Workshop + async | Workshop + async |
Outputdifferent | Simulation Model, Scenario Reports | Root cause notes, Countermeasures | Change Matrix, Cause Hypotheses, Validation Questions, Action List | Stock and Flow Model, Dynamics Notes, Simulation Hypotheses |
Tagsno overlap | Systems thinkingDynamicsSimulationAnalysis | Root causeIncidentLeanProblem solving | ChangeRoot causeTroubleshootingComparison | DynamicsSimulationFeedbackSystems thinking |