View methods side by side.
Choose up to four methods. Add them using the search and share the comparison by copying its link.
| Criterion | 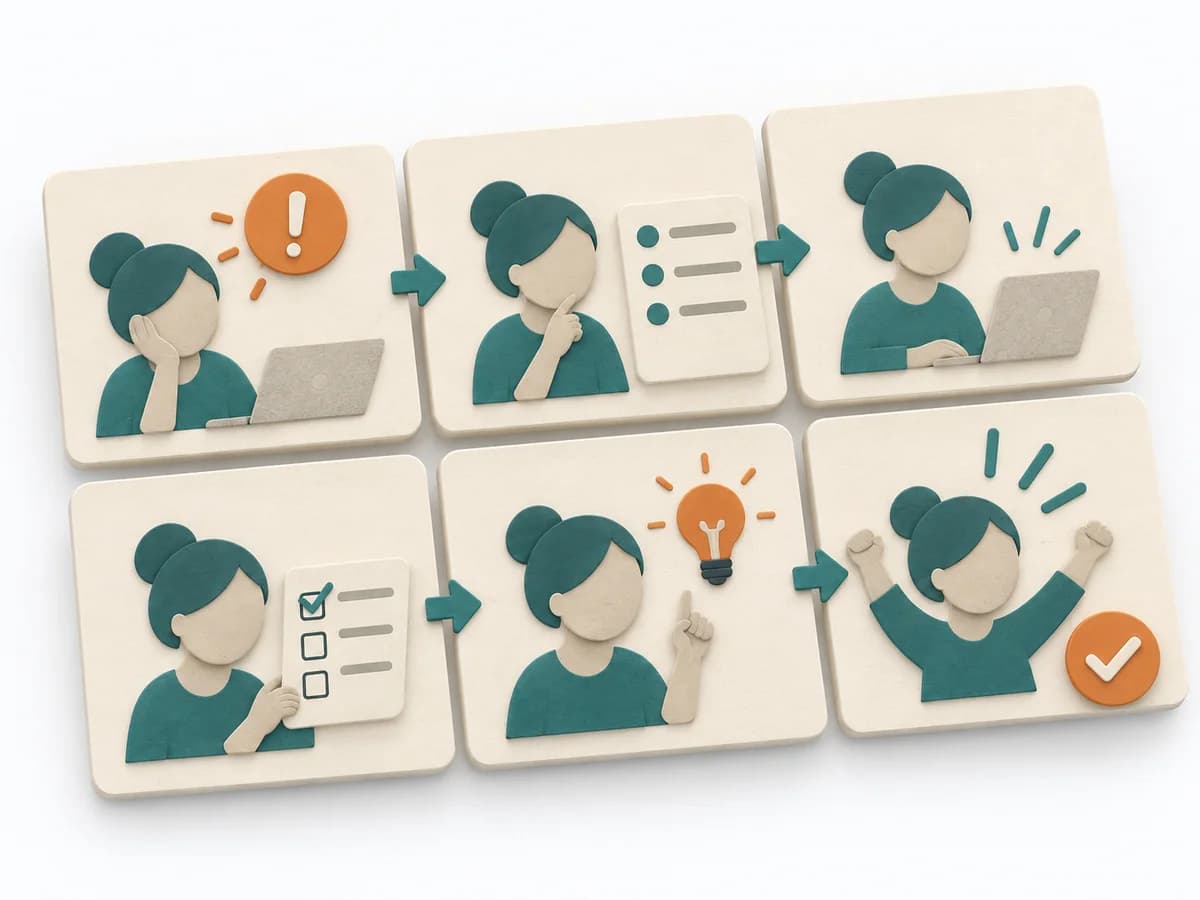 UX Design Storyboarding | 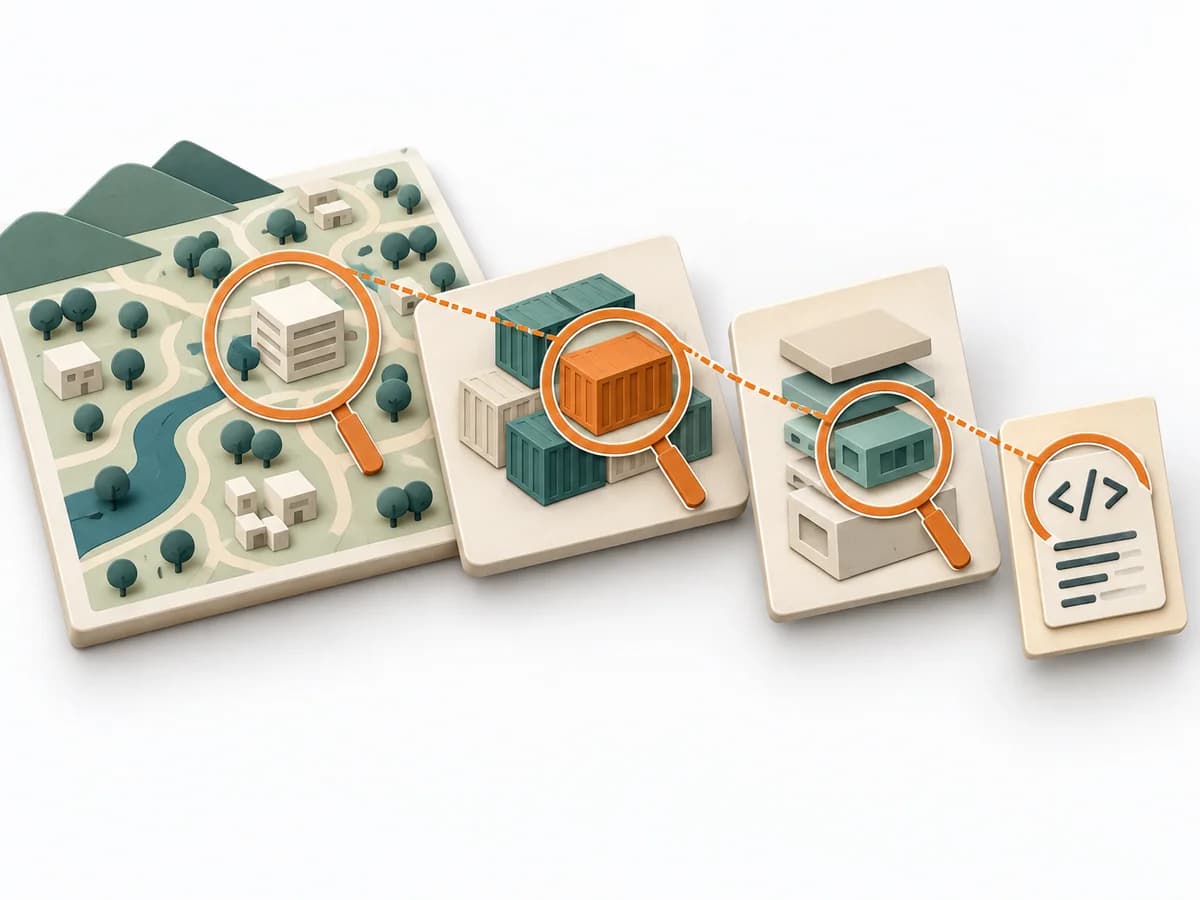 Architecture C4 Model | 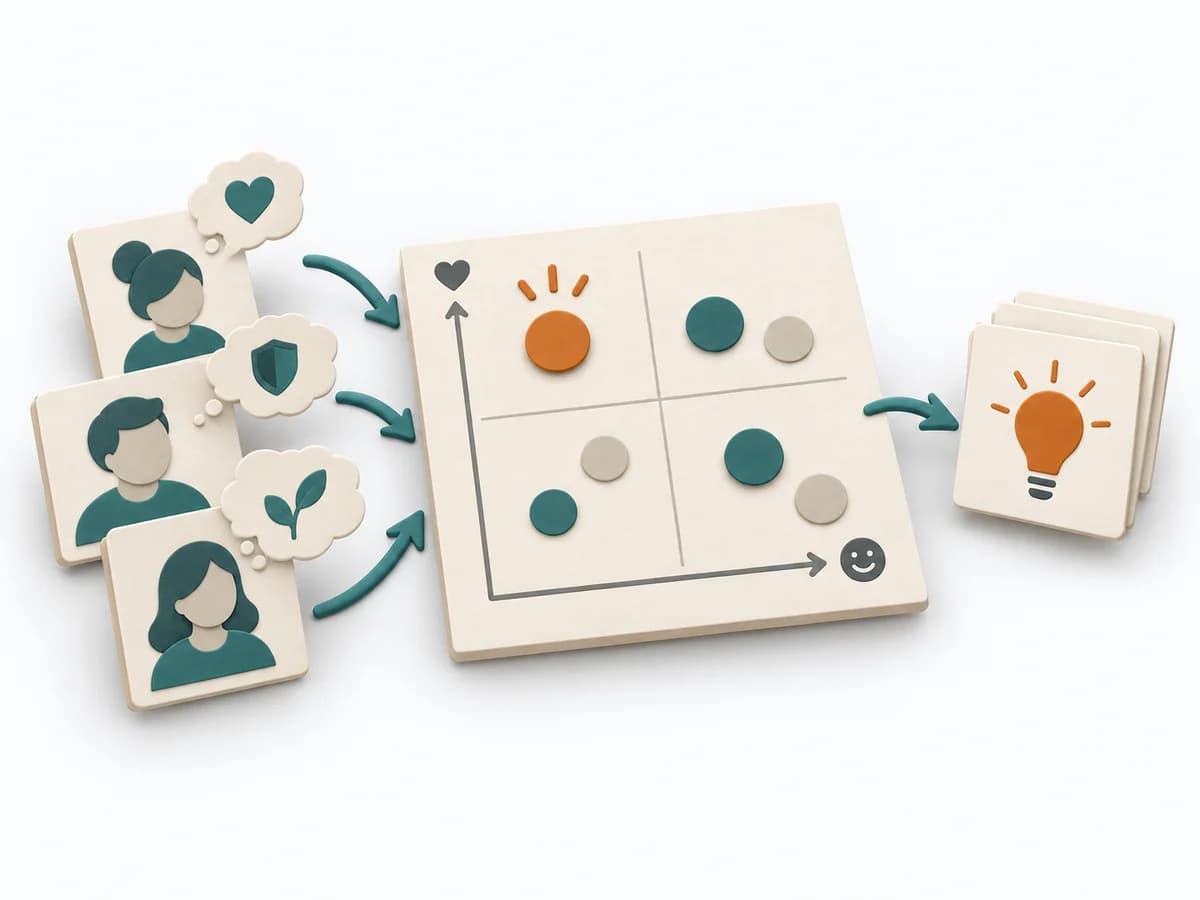 Product Discovery Outcome-Driven Innovation | 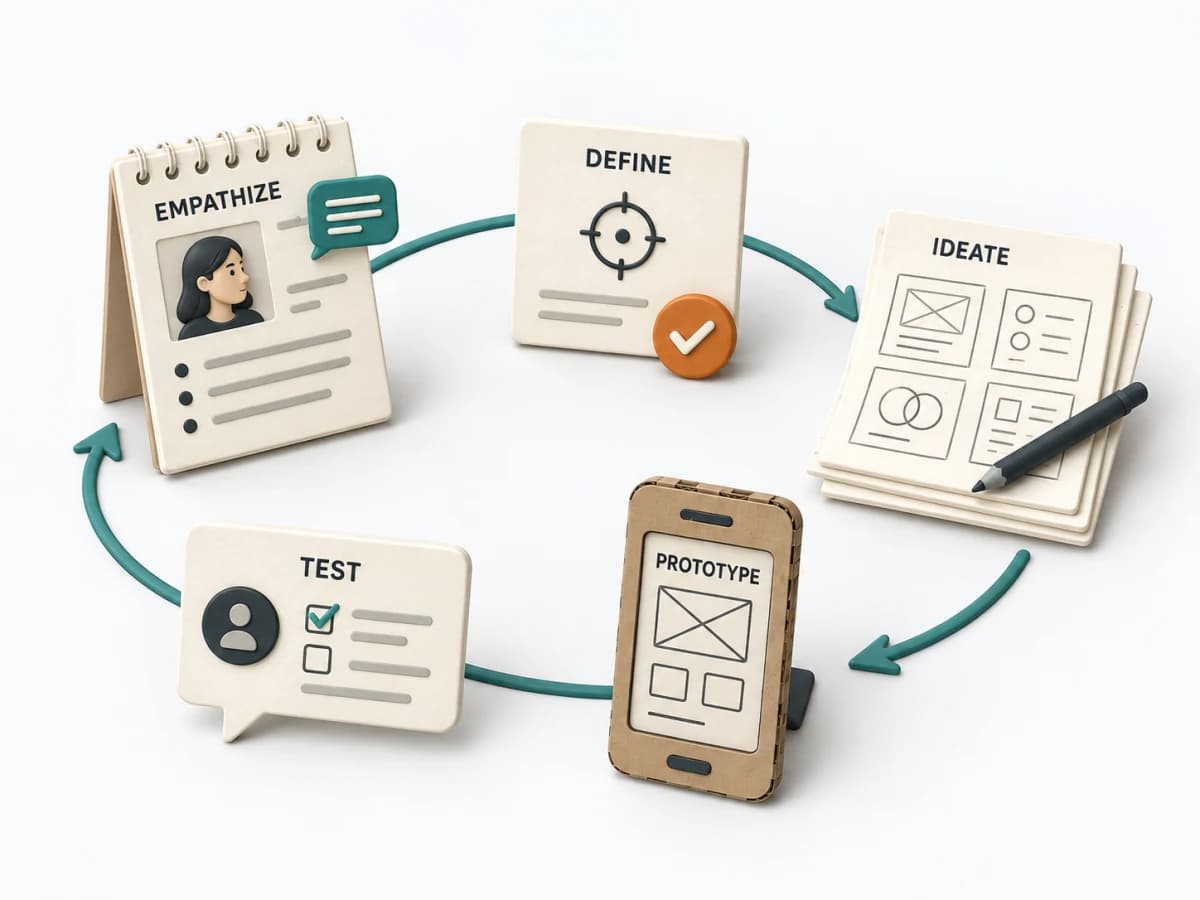 Innovation Design Thinking |
|---|---|---|---|---|
Purposedifferent | When a usage scenario needs to become understandable early, it condenses situations, context, and flow into a legible sequence. It helps check concept ideas before anything gets built. | The C4 Model makes a system legible across several resolution levels, from context down to code. It suits situations where different audiences need to understand the same architecture from different altitudes. | Outcome-Driven Innovation clarifies customer problems, solution opportunities, and evidence. It separates jobs, desired outcomes, importance, satisfaction, and opportunity, and captures results as desired outcome statements, an opportunity landscape, and segments by underserved needs. | For complex user problems with an uncertain cause, the method connects observation, interpretation, and experiment into a learning cycle. It keeps the focus on real needs and avoids premature solution language. This produces robust decisions for product and service. |
Complexitydifferent | Medium | Low | High | High |
Timedifferent | 30-90 min | 1-4 h | Mehrere Wochen | 1 Tag bis mehrere Wochen |
Participantsdifferent | 1-8 | 1-5 | 2-6 researchers plus sample | 4-10 |
Formatdifferent | Workshop + async | Workshop + async | Workshop + async | Workshop |
Outputdifferent | Storyboard, Concept Narrative, Testable Assumptions | Context Diagram, Container Diagram, Component Diagram | Desired outcome statements, Opportunity landscape, Segmentation by underserved needs, Innovation hypotheses | Problem Statement, Prototype, Test Learnings |
Tagsno overlap | VisualizationConceptsSequencePrototype | ArchitectureCommunicationVisualization | OutcomesInnovationResearchQuantitative | InnovationPrototypeResearch |