View methods side by side.
Choose up to four methods. Add them using the search and share the comparison by copying its link.
| Criterion |  Agile Story Points | 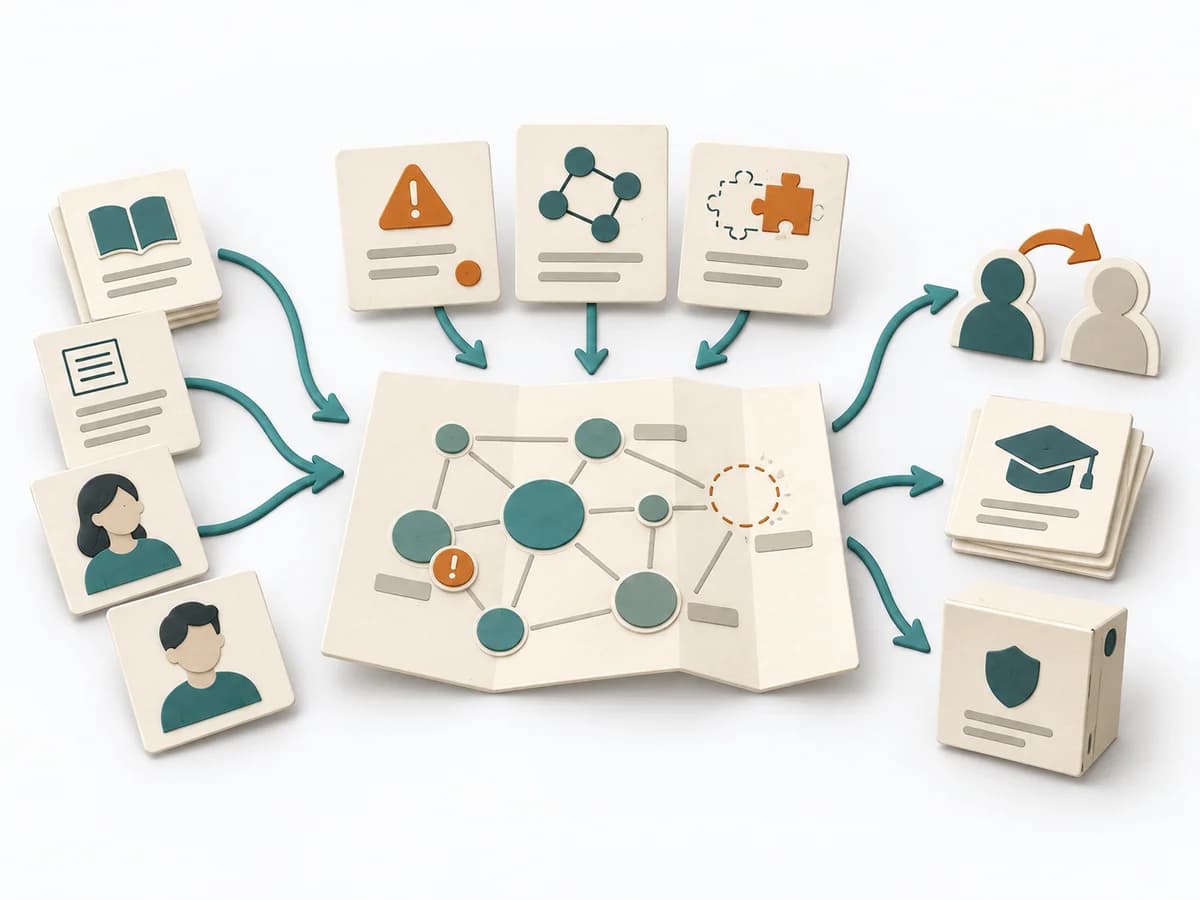 Knowledge Modeling Knowledge Mapping | 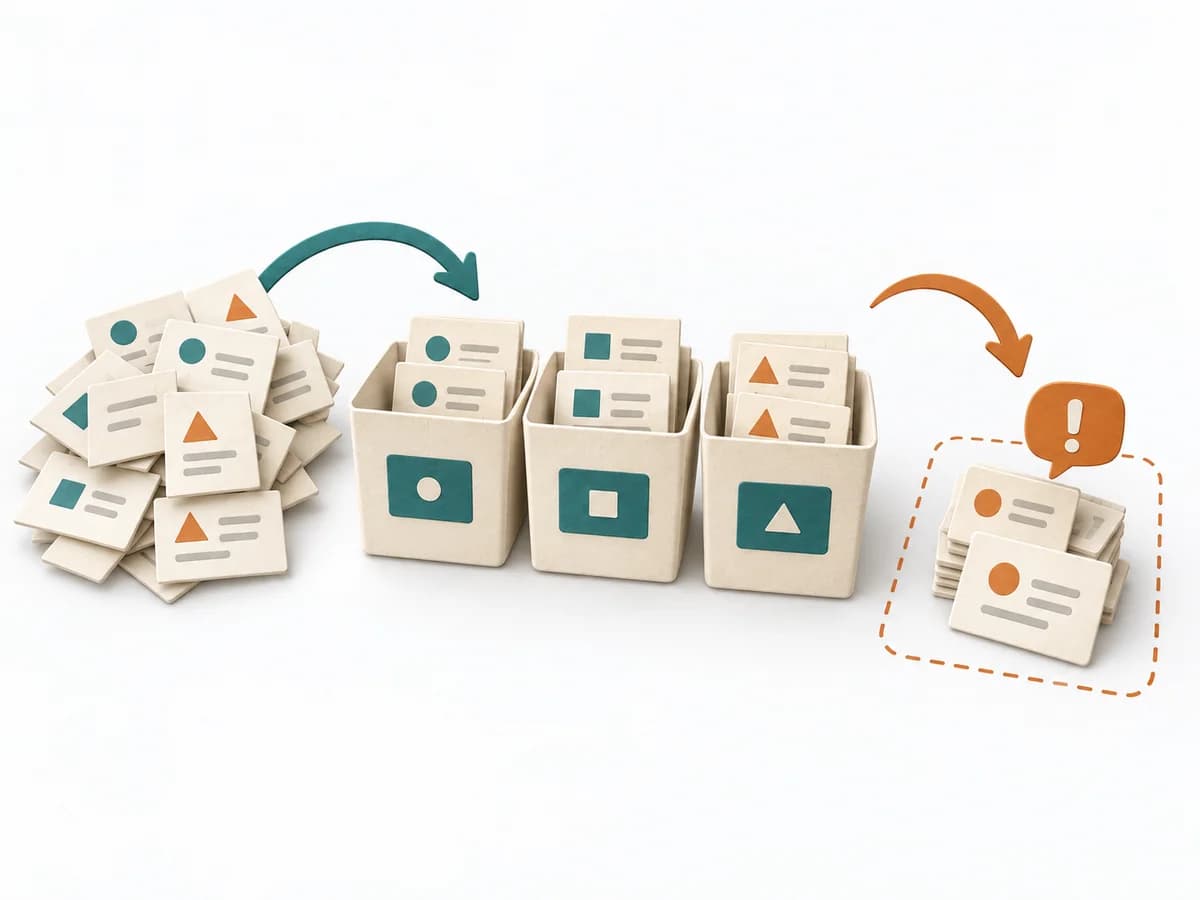 Agile Bucket System |  Facilitation Dot Estimation |
|---|---|---|---|---|
Purposedifferent | When teams want to rate complexity rather than hours, it creates a shared, relative scale. It sorts work by value, risk, and delivery ability. The result is captured as Point Estimates, Reference Stories, and Velocity Data. | Knowledge Mapping makes knowledge, gaps, and transfer paths visible across a field. It fits when expertise should not just exist but also be findable and transferable. | When a large batch of work needs a fast, rough estimate, it sorts items into predefined size buckets. It sorts work by value, risk, and delivery ability. The result is captured as a Bucketed Backlog, Relative Estimates, and Split Candidates. | When size or effort can only be estimated roughly, Dot Estimation condenses the group's experience into a quick range. It turns individual contributions into a visible selection. The result is captured as an Effort Heatmap, Risk Signals, and Discussion Targets. |
Complexitydifferent | Medium | Medium | Medium | Low |
Timedifferent | laufend, 1-5 min je Item | 1-3 h | 30-90 min | 5-20 min |
Participantsdifferent | 3-9 | 3-12 | 3-12 | 3-20 |
Formatdifferent | Workshop + async | Workshop | Workshop | Workshop |
Outputdifferent | Point Estimates, Reference Stories, Velocity Data | Knowledge Map, Critical Knowledge Areas, Transfer Plan | Bucketed Backlog, Relative Estimates, Split Candidates | Effort Heatmap, Risk Signals, Discussion Targets |
Tagsno overlap | EstimationAgileMeasurement | KnowledgeMappingRisk | EstimationBacklogRelative sizing | EstimationEffortRisk |