View methods side by side.
Choose up to four methods. Add them using the search and share the comparison by copying its link.
| Criterion | 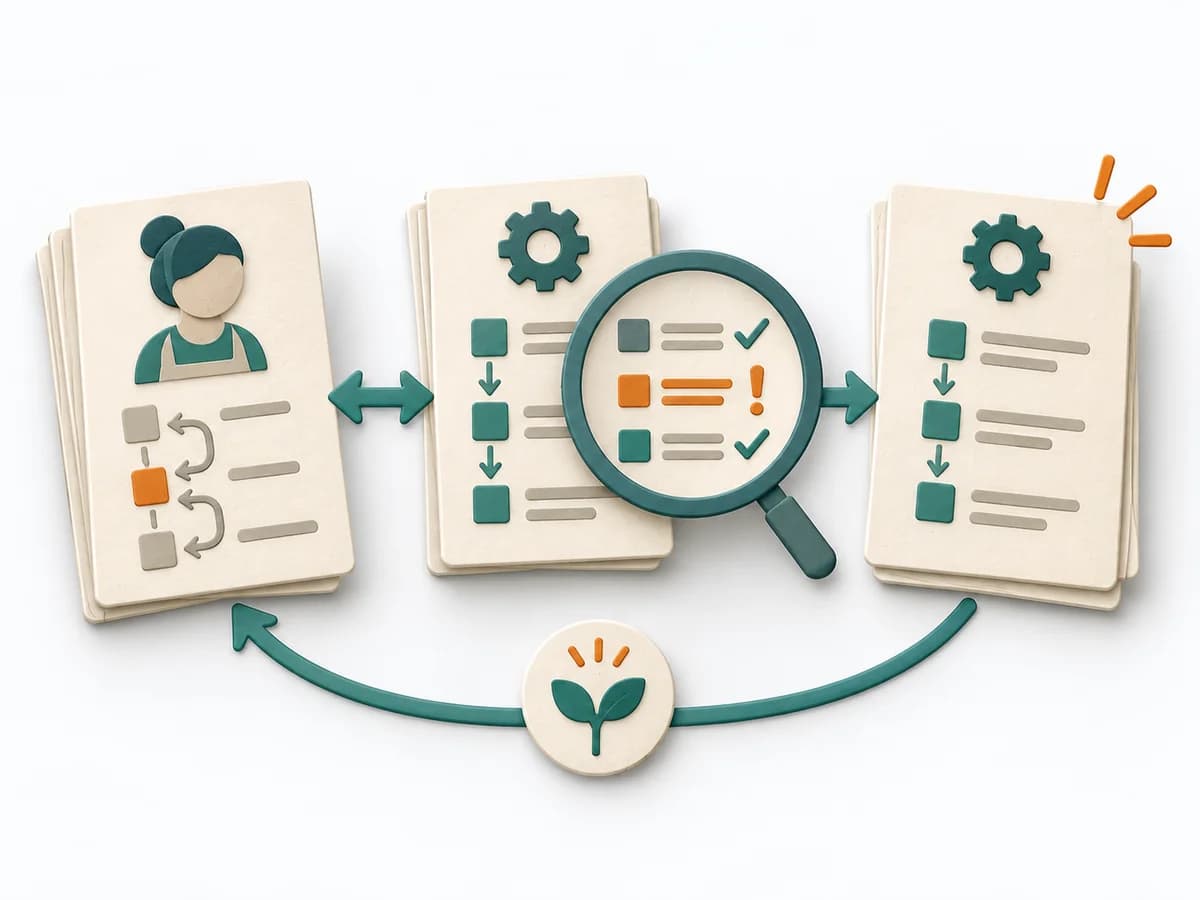 Operations Standard Work Analysis |  Delivery Value Stream Mapping |  Agile NoEstimates |  Delivery Monte Carlo Forecasting |
|---|---|---|---|---|
Purposedifferent | When the same task is done differently depending on the person, the method exposes the reliable core. It creates comparability without unnecessarily choking off needed latitude. | When delivery work dissolves into wait times, handoffs, and hidden effort, Value Stream Mapping makes the actual flow visible. The method exposes bottlenecks, idle time, and feedback loops so lead time and improvement levers become tangible. | When estimating slows a team down more than it helps, it shifts the focus to flow, small slices, and real lead time. It sorts work by value, risk, and delivery ability. The result is captured as Throughput Data, Flow Forecast, and Slicing Rules. | Helps clarify scope, sequence, and delivery flow in concrete terms. It makes work, boundaries, and order steerable. The result is captured as Forecast Percentiles, Throughput Dataset, and Risk Communication. |
Complexitydifferent | Medium | Medium | Medium | High |
Timedifferent | 1-3 h | 1-3 h | laufend | 30-90 min Setup, danach laufend |
Participantsdifferent | 2-6 | 4-10 | 2-12 | 1-8 |
Formatdifferent | Workshop | Workshop | Workshop + async | Workshop + async |
Outputdifferent | Standard Work Sheet, Deviation List, Improved Standard, Training Needs | Current-state map, Future-state map, Bottleneck list | Throughput Data, Flow Forecast, Slicing Rules | Forecast Percentiles, Throughput Dataset, Risk Communication |
Tagsno overlap | LeanProcessQuality | LeanFlowWasteDelivery | EstimationForecastingFlow | ForecastingFlowDelivery |