View methods side by side.
Choose up to four methods. Add them using the search and share the comparison by copying its link.
| Criterion | 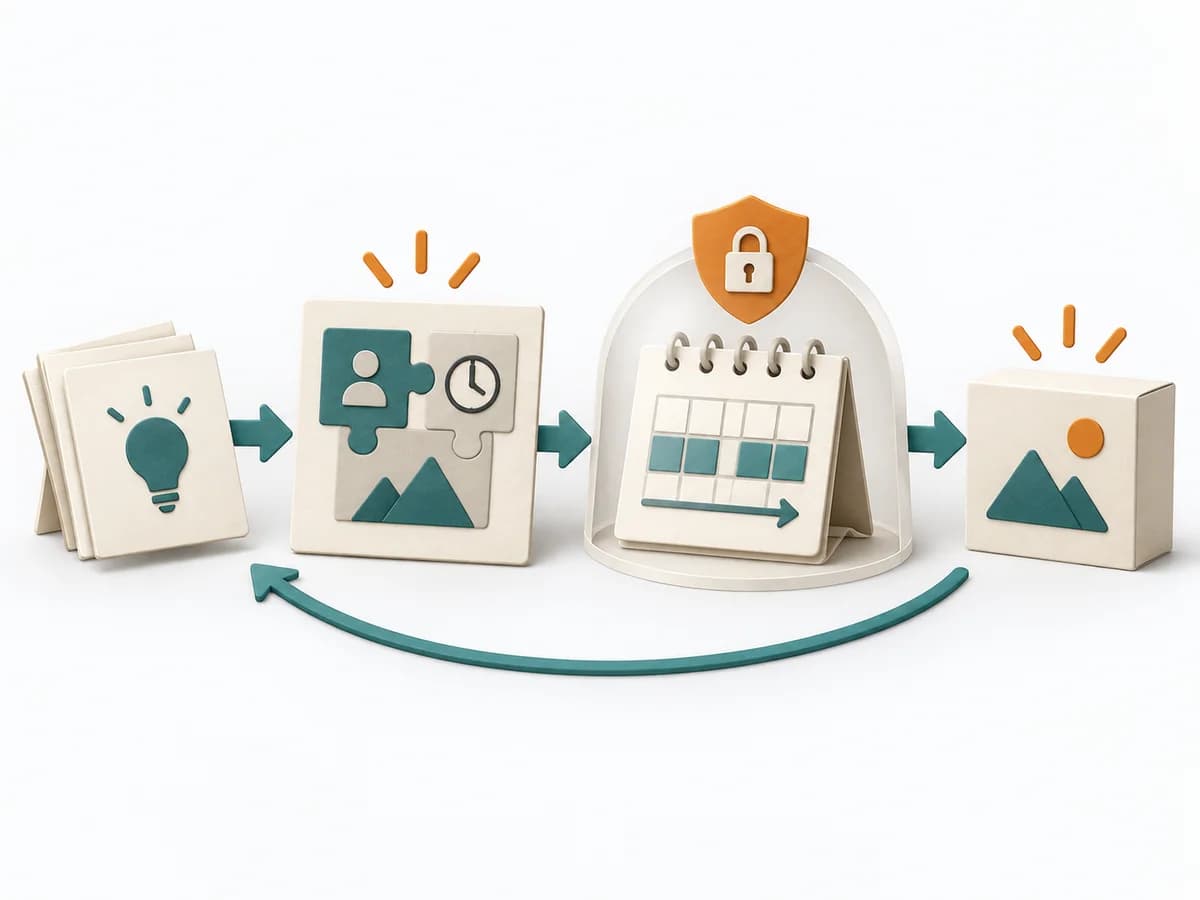 Delivery Shape Up |  Operations Process Mapping |  Operations Root Cause Analysis |  Operations Failure Mode and Effects Analysis |
|---|---|---|---|---|
Purposedifferent | Shape Up helps clarify scope, sequence, and delivery flow. It makes work boundaries and decisions explicit and captures results as pitches, bet-table decisions, and hill charts. | With a confusing workflow that has many handoffs, the method makes the actual process visible. It shows where work is passed on, delayed, or duplicated, so improvement targets the right spots. | When a problem keeps recurring and the cause stays unclear, the method exposes the underlying mechanism. It separates symptom, guess, and robust explanation from one another. | For a process, product, or service with noticeable failure risks, the method assesses possible failure modes in advance. It directs attention to combinations of occurrence, effect, and detectability. |
Complexitydifferent | Medium | Medium | Medium | High |
Timedifferent | 6 Wochen Cycle + 2 Wochen Cool-Down | 1-3 h | 1-4 h | 2-6 h |
Participantsdifferent | 2-4 pro Pitch | 3-10 | 3-8 | 3-10 |
Formatdifferent | Workshop + async | Workshop | Workshop + async | Workshop |
Outputdifferent | Pitches, Bet-table decisions, Hill charts, Cooldown outcomes | Process Map, Handoff List, Improvement Backlog | Problem Statement, Cause Hypotheses, Confirmed Causes, Action Plan | FMEA Table, Risk Priority, Mitigation Actions |
Tagsno overlap | PlanningDeliveryAutonomy | ProcessOperationsImprovement | Root causeProblem solvingQualityIncident | RiskQualityOperationsRoot cause |