View methods side by side.
Choose up to four methods. Add them using the search and share the comparison by copying its link.
| Criterion | 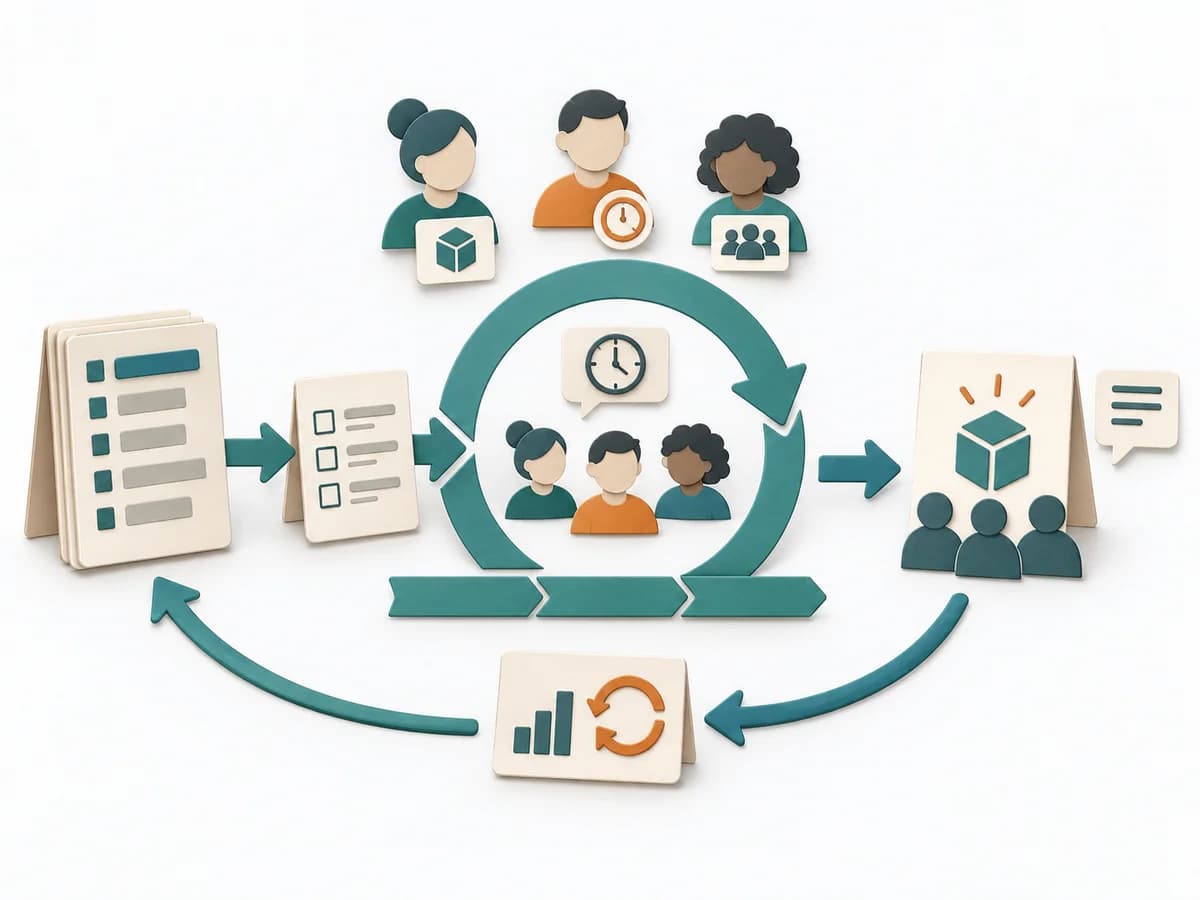 Agile Scrum |  Operations Failure Mode and Effects Analysis | 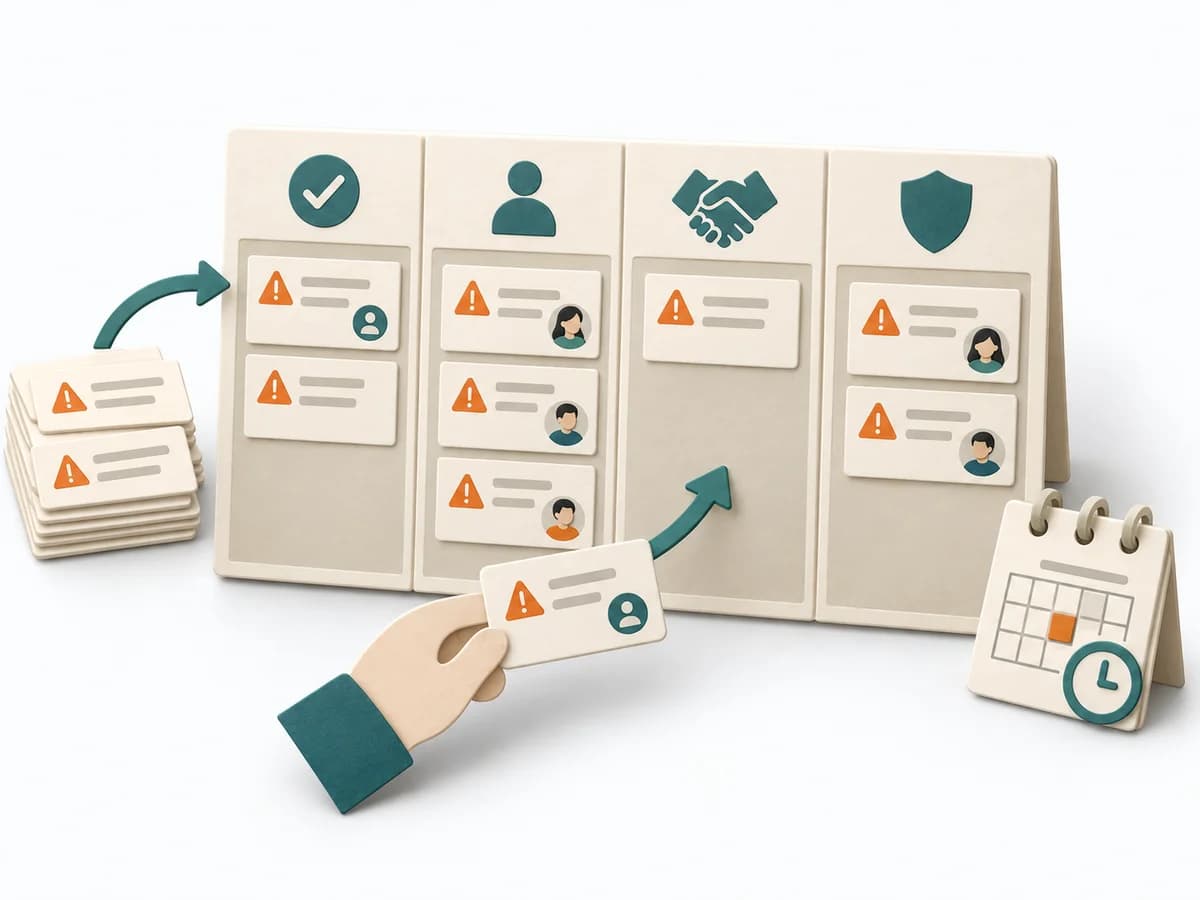 Agile ROAM Board |  Operations Fishbone Diagram |
|---|---|---|---|---|
Purposedifferent | When a team needs to work in a fixed delivery rhythm, it stabilizes cadence, responsibility, and feedback loops. It makes collaboration reliable across sprint boundaries. | For a process, product, or service with noticeable failure risks, the method assesses possible failure modes in advance. It directs attention to combinations of occurrence, effect, and detectability. | When work needs to move between different states or columns, it makes that movement and its handoffs legible. It sorts work by value, risk, and delivery ability. The result is captured as a ROAM Board and an Owner List. | When a problem has several possible contributing factors, the method sorts causes by cause areas. It prevents an initial hunch from blocking the view of other plausible drivers. |
Complexitydifferent | Medium | High | Low | Low |
Timedifferent | 1-4 Wochen je Sprint, laufend | 2-6 h | 20-40 min initial, dann laufend | 30-60 min |
Participantsdifferent | 3-10 (Scrum Team) | 3-10 | 3-15 | 2-8 |
Formatdifferent | Workshop + async | Workshop | Workshop + async | Workshop |
Outputdifferent | Product Backlog, Sprint Backlog, Increment, Sprint Goal | FMEA Table, Risk Priority, Mitigation Actions | ROAM Board, Owner List | Fishbone Diagram, Cause Categories, Investigation Backlog |
Tagsno overlap | AgileIterationCadence | RiskQualityOperationsRoot cause | RiskAgileTrackingAlignment | Root causeQualityOperations |