View methods side by side.
Choose up to four methods. Add them using the search and share the comparison by copying its link.
| Criterion |  Operations Scatter Diagram | 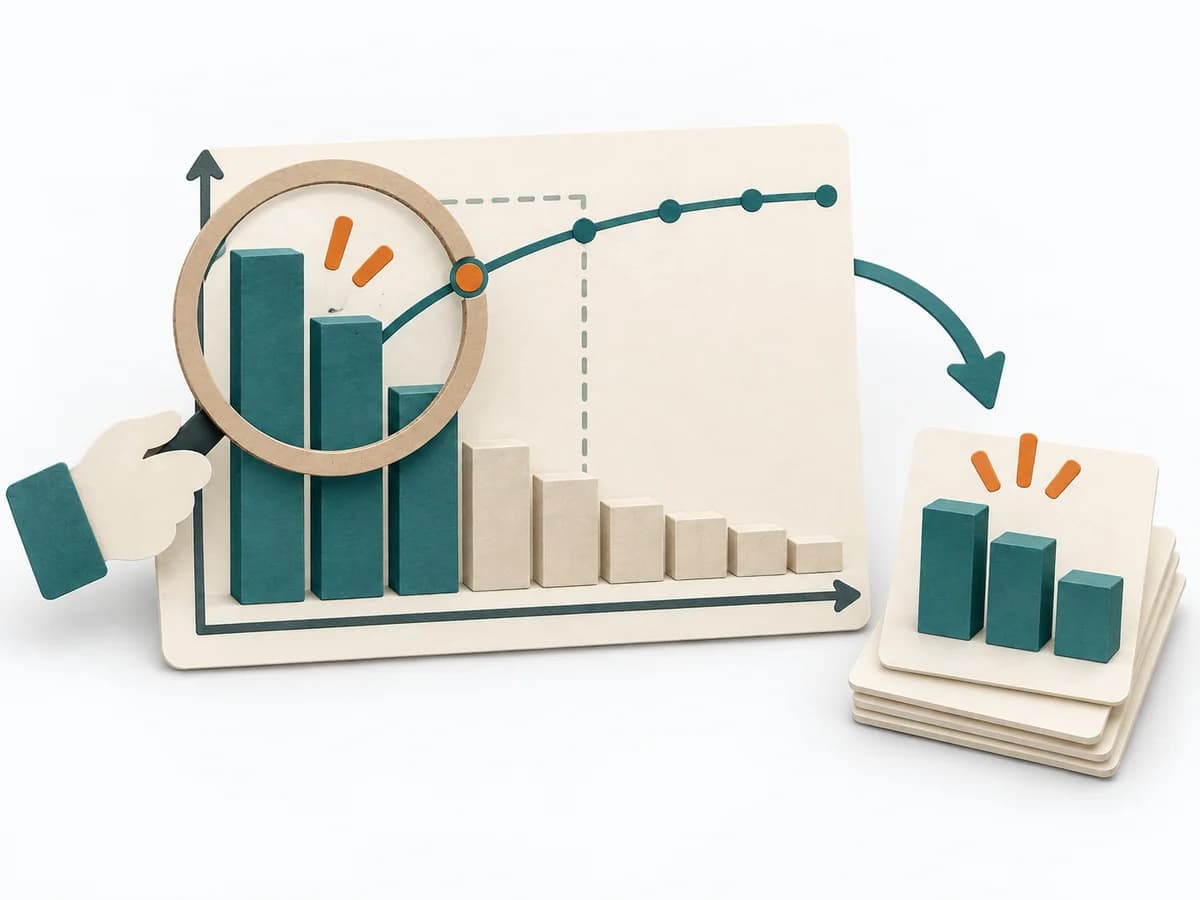 Decision Making Pareto Analysis |  Operations Barrier Analysis |  Operations Root Cause Analysis |
|---|---|---|---|---|
Purposedifferent | When the question is whether two measures are related, the method makes patterns in the data picture visible. It separates felt correlations from relationships that actually show up in the data. | In many problem situations, effect is distributed unequally across many causes. A Pareto Analysis separates the few drivers with high leverage from the long remainder and focuses attention on what measurably moves the needle. | For a risk that can only be managed through multiple layers of protection, the method examines the effectiveness of each barrier. It shows where safeguards are missing, too weak, or fail under real conditions. | When a problem keeps recurring and the cause stays unclear, the method exposes the underlying mechanism. It separates symptom, guess, and robust explanation from one another. |
Complexitydifferent | Low | Low | Medium | Medium |
Timedifferent | 30-90 min | 30-60 min | 2-4 h | 1-4 h |
Participantsdifferent | 1-4 | 1-6 | 2-6 | 3-8 |
Formatsame | Workshop + async | Workshop + async | Workshop + async | Workshop + async |
Outputdifferent | Scatter Plot, Korrelationsnotiz, Hypothesenliste | Pareto Chart, Top Causes, Focus List | Barrier Inventory, Failure Analysis per Barrier, Action Backlog | Problem Statement, Cause Hypotheses, Confirmed Causes, Action Plan |
Tags1 shared | Root causeQualityVisualization | PrioritizationQualityFocusRoot cause | Root causeSafetyIncident | Root causeProblem solvingQualityIncident |