View methods side by side.
Choose up to four methods. Add them using the search and share the comparison by copying its link.
| Criterion |  Operations Scatter Diagram | 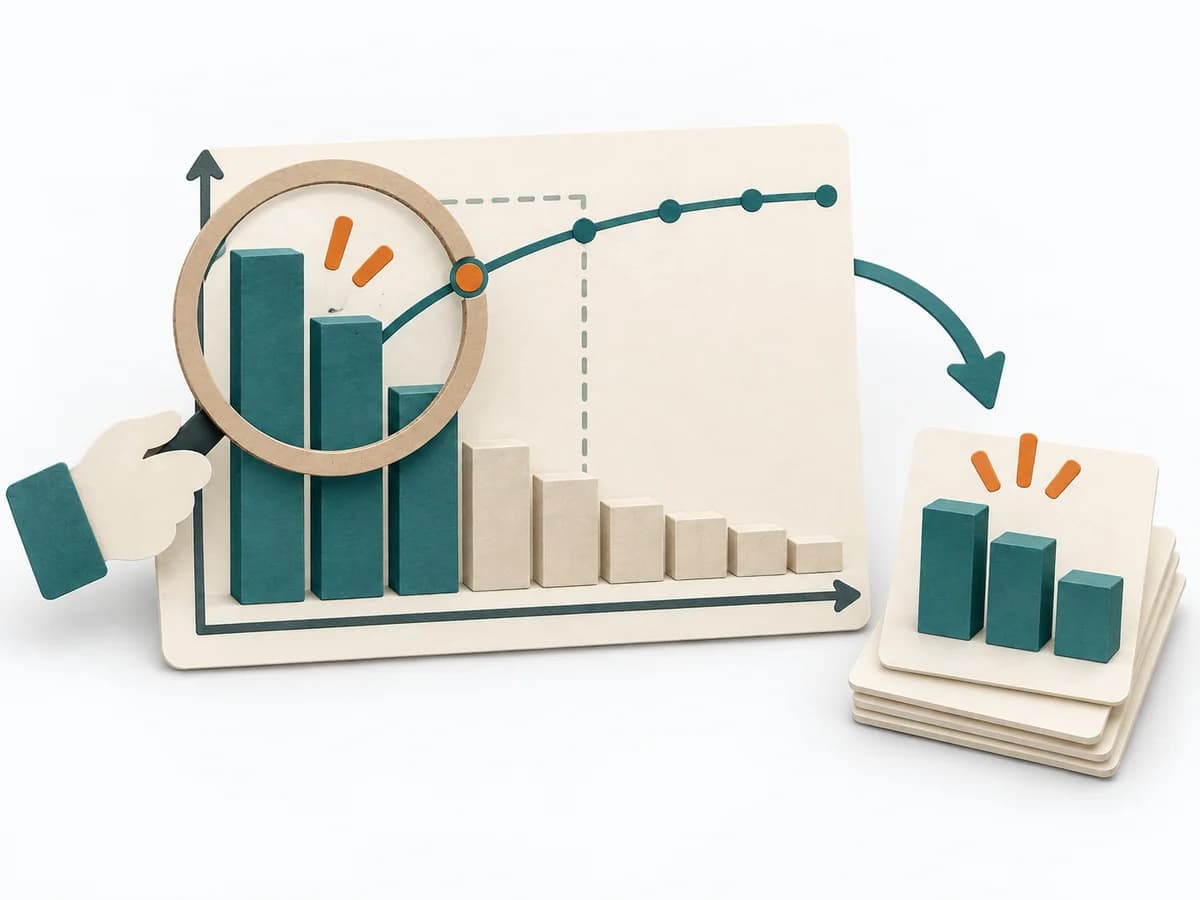 Decision Making Pareto Analysis |  Decision Making Assumption Surfacing |  Operations Failure Mode and Effects Analysis |
|---|---|---|---|---|
Purposedifferent | When the question is whether two measures are related, the method makes patterns in the data picture visible. It separates felt correlations from relationships that actually show up in the data. | In many problem situations, effect is distributed unequally across many causes. A Pareto Analysis separates the few drivers with high leverage from the long remainder and focuses attention on what measurably moves the needle. | Plans often contain assumptions that were never openly stated and remain dangerous precisely because of that. Assumption Surfacing makes these silent premises visible and prioritizes which of them carry the initiative or could sink it. | For a process, product, or service with noticeable failure risks, the method assesses possible failure modes in advance. It directs attention to combinations of occurrence, effect, and detectability. |
Complexitydifferent | Low | Low | Low | High |
Timedifferent | 30-90 min | 30-60 min | 45-90 min | 2-6 h |
Participantsdifferent | 1-4 | 1-6 | 2-8 | 3-10 |
Formatdifferent | Workshop + async | Workshop + async | Workshop + async | Workshop |
Outputdifferent | Scatter Plot, Korrelationsnotiz, Hypothesenliste | Pareto Chart, Top Causes, Focus List | Assumption List, Critical Assumptions, Learning Plan | FMEA Table, Risk Priority, Mitigation Actions |
Tagsno overlap | Root causeQualityVisualization | PrioritizationQualityFocusRoot cause | AssumptionsRiskDecisionDiscovery | RiskQualityOperationsRoot cause |