View methods side by side.
Choose up to four methods. Add them using the search and share the comparison by copying its link.
Selected:Scatter DiagramLASR (Lightweight Approach for Software Reviews)Risk MatrixFailure Mode and Effects Analysis
| Criterion |  Operations Scatter Diagram |  Architecture LASR (Lightweight Approach for Software Reviews) | 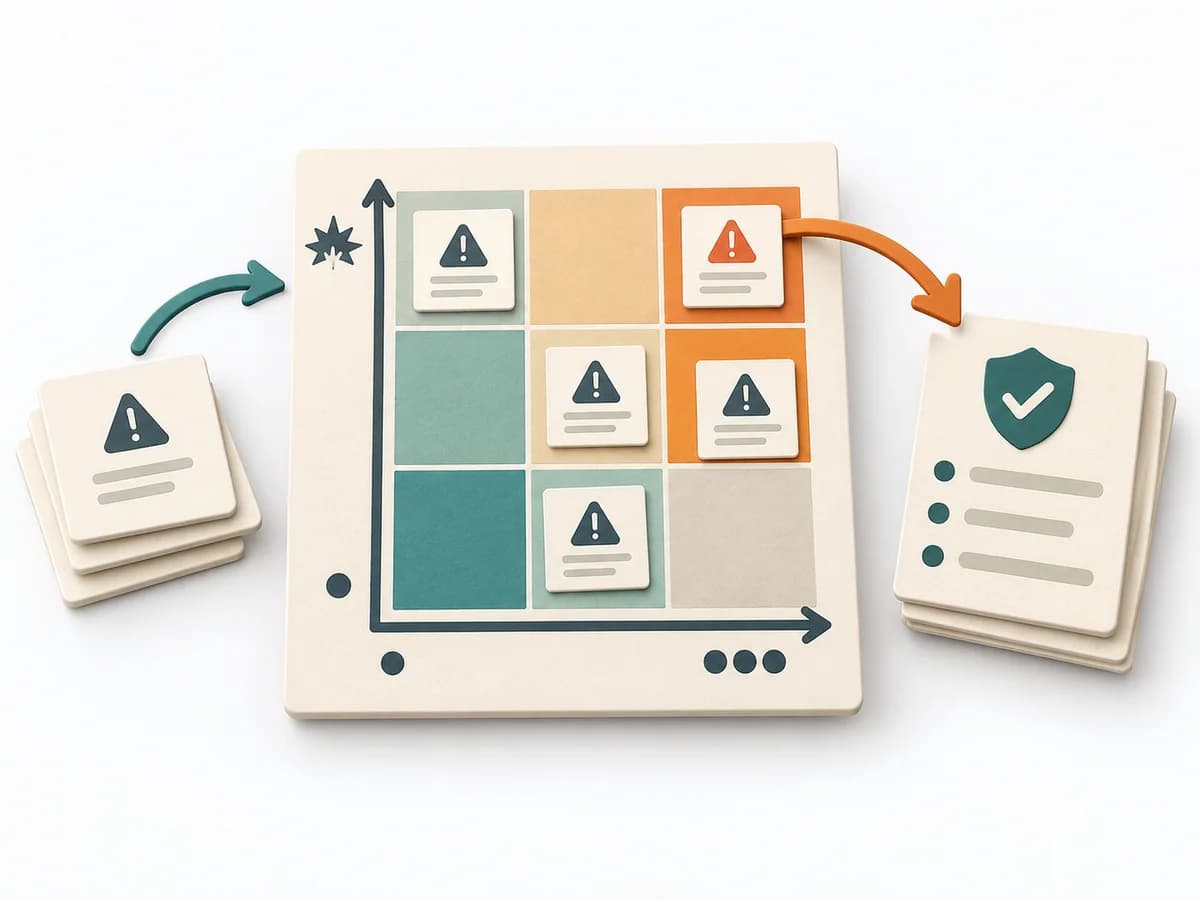 Decision Making Risk Matrix |  Operations Failure Mode and Effects Analysis |
|---|---|---|---|---|
Purposedifferent | When the question is whether two measures are related, the method makes patterns in the data picture visible. It separates felt correlations from relationships that actually show up in the data. | LASR helps development teams identify where their software falls short of important quality goals and which improvements to consider. A small group with existing system knowledge can make an initial assessment and investigate open questions in more detail. | When a project faces many possible disruptions, it quickly becomes unclear which risks deserve attention first. It separates options, evaluation criteria, and open risks. The result is captured as a Risk Matrix and a Top Risk List. | For a process, product, or service with noticeable failure risks, the method assesses possible failure modes in advance. It directs attention to combinations of occurrence, effect, and detectability. |
Complexitydifferent | Low | Medium | Low | High |
Timedifferent | 30-90 min | 3–4 h for initial assessment; preparation and deeper analysis additional | 30-60 min | 2-6 h |
Participantsdifferent | 1-4 | 1 or a small team; particularly suitable for 3–4 people | 3-10 | 3-10 |
Formatdifferent | Workshop + async | Workshop + async | Workshop + async | Workshop |
Outputdifferent | Scatter Plot, Korrelationsnotiz, Hypothesenliste | Lean Mission Statement describing the software’s purpose, Prioritized quality goals and evaluation criteria, Risks and estimated gaps against quality goals, More closely examined findings and open checks | Risk Matrix, Top Risk List | FMEA Table, Risk Priority, Mitigation Actions |
Tagsno overlap | Root causeQualityVisualization | ArchitectureQualityRiskAssessmentLean | RiskDecisionPrioritizationAssessment | RiskQualityOperationsRoot cause |